
Chart Library
Charts and sector trackers published in Market Mosaic, each with the edition it came from.
 ChartEdition #142
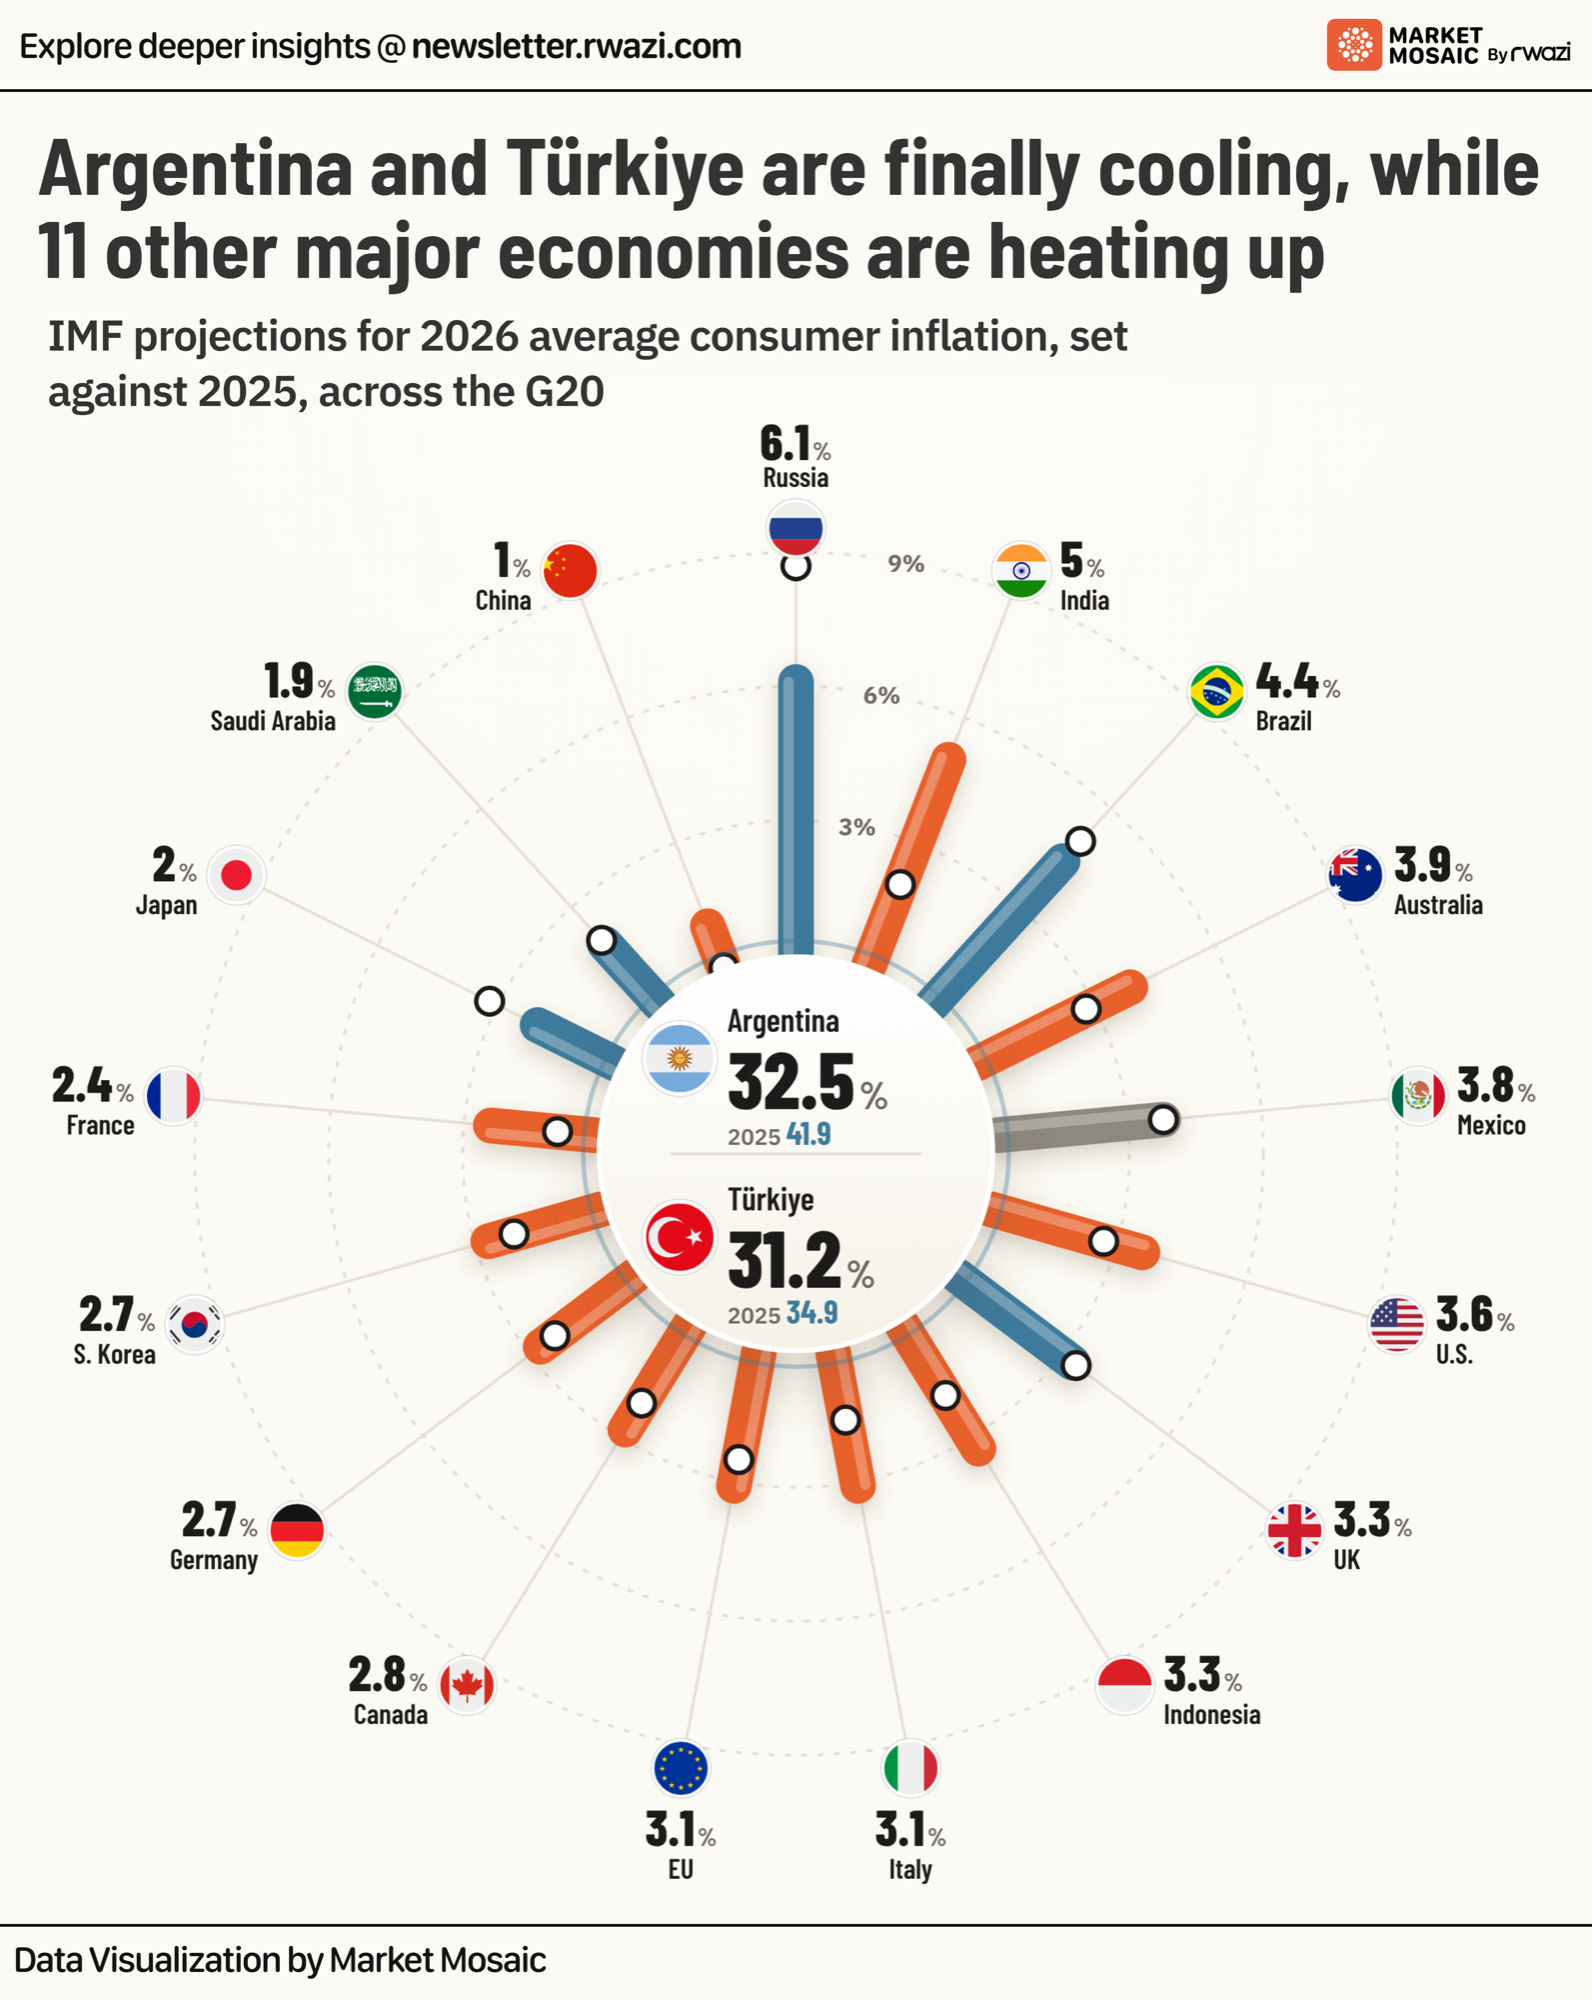
Argentina and Türkiye are cooling from inflation above 30% while 11 other major economies are heating up
Projected inflation in Argentina falls to 32.5% from 41.9% and in Türkiye to 31.2% from 34.9%, and no other economy on the list tops 6.1%. Across 19 major economies, 11 are projected to see faster price growth in 2026, 7 slower and 1 unchanged.
 ChartEdition #139
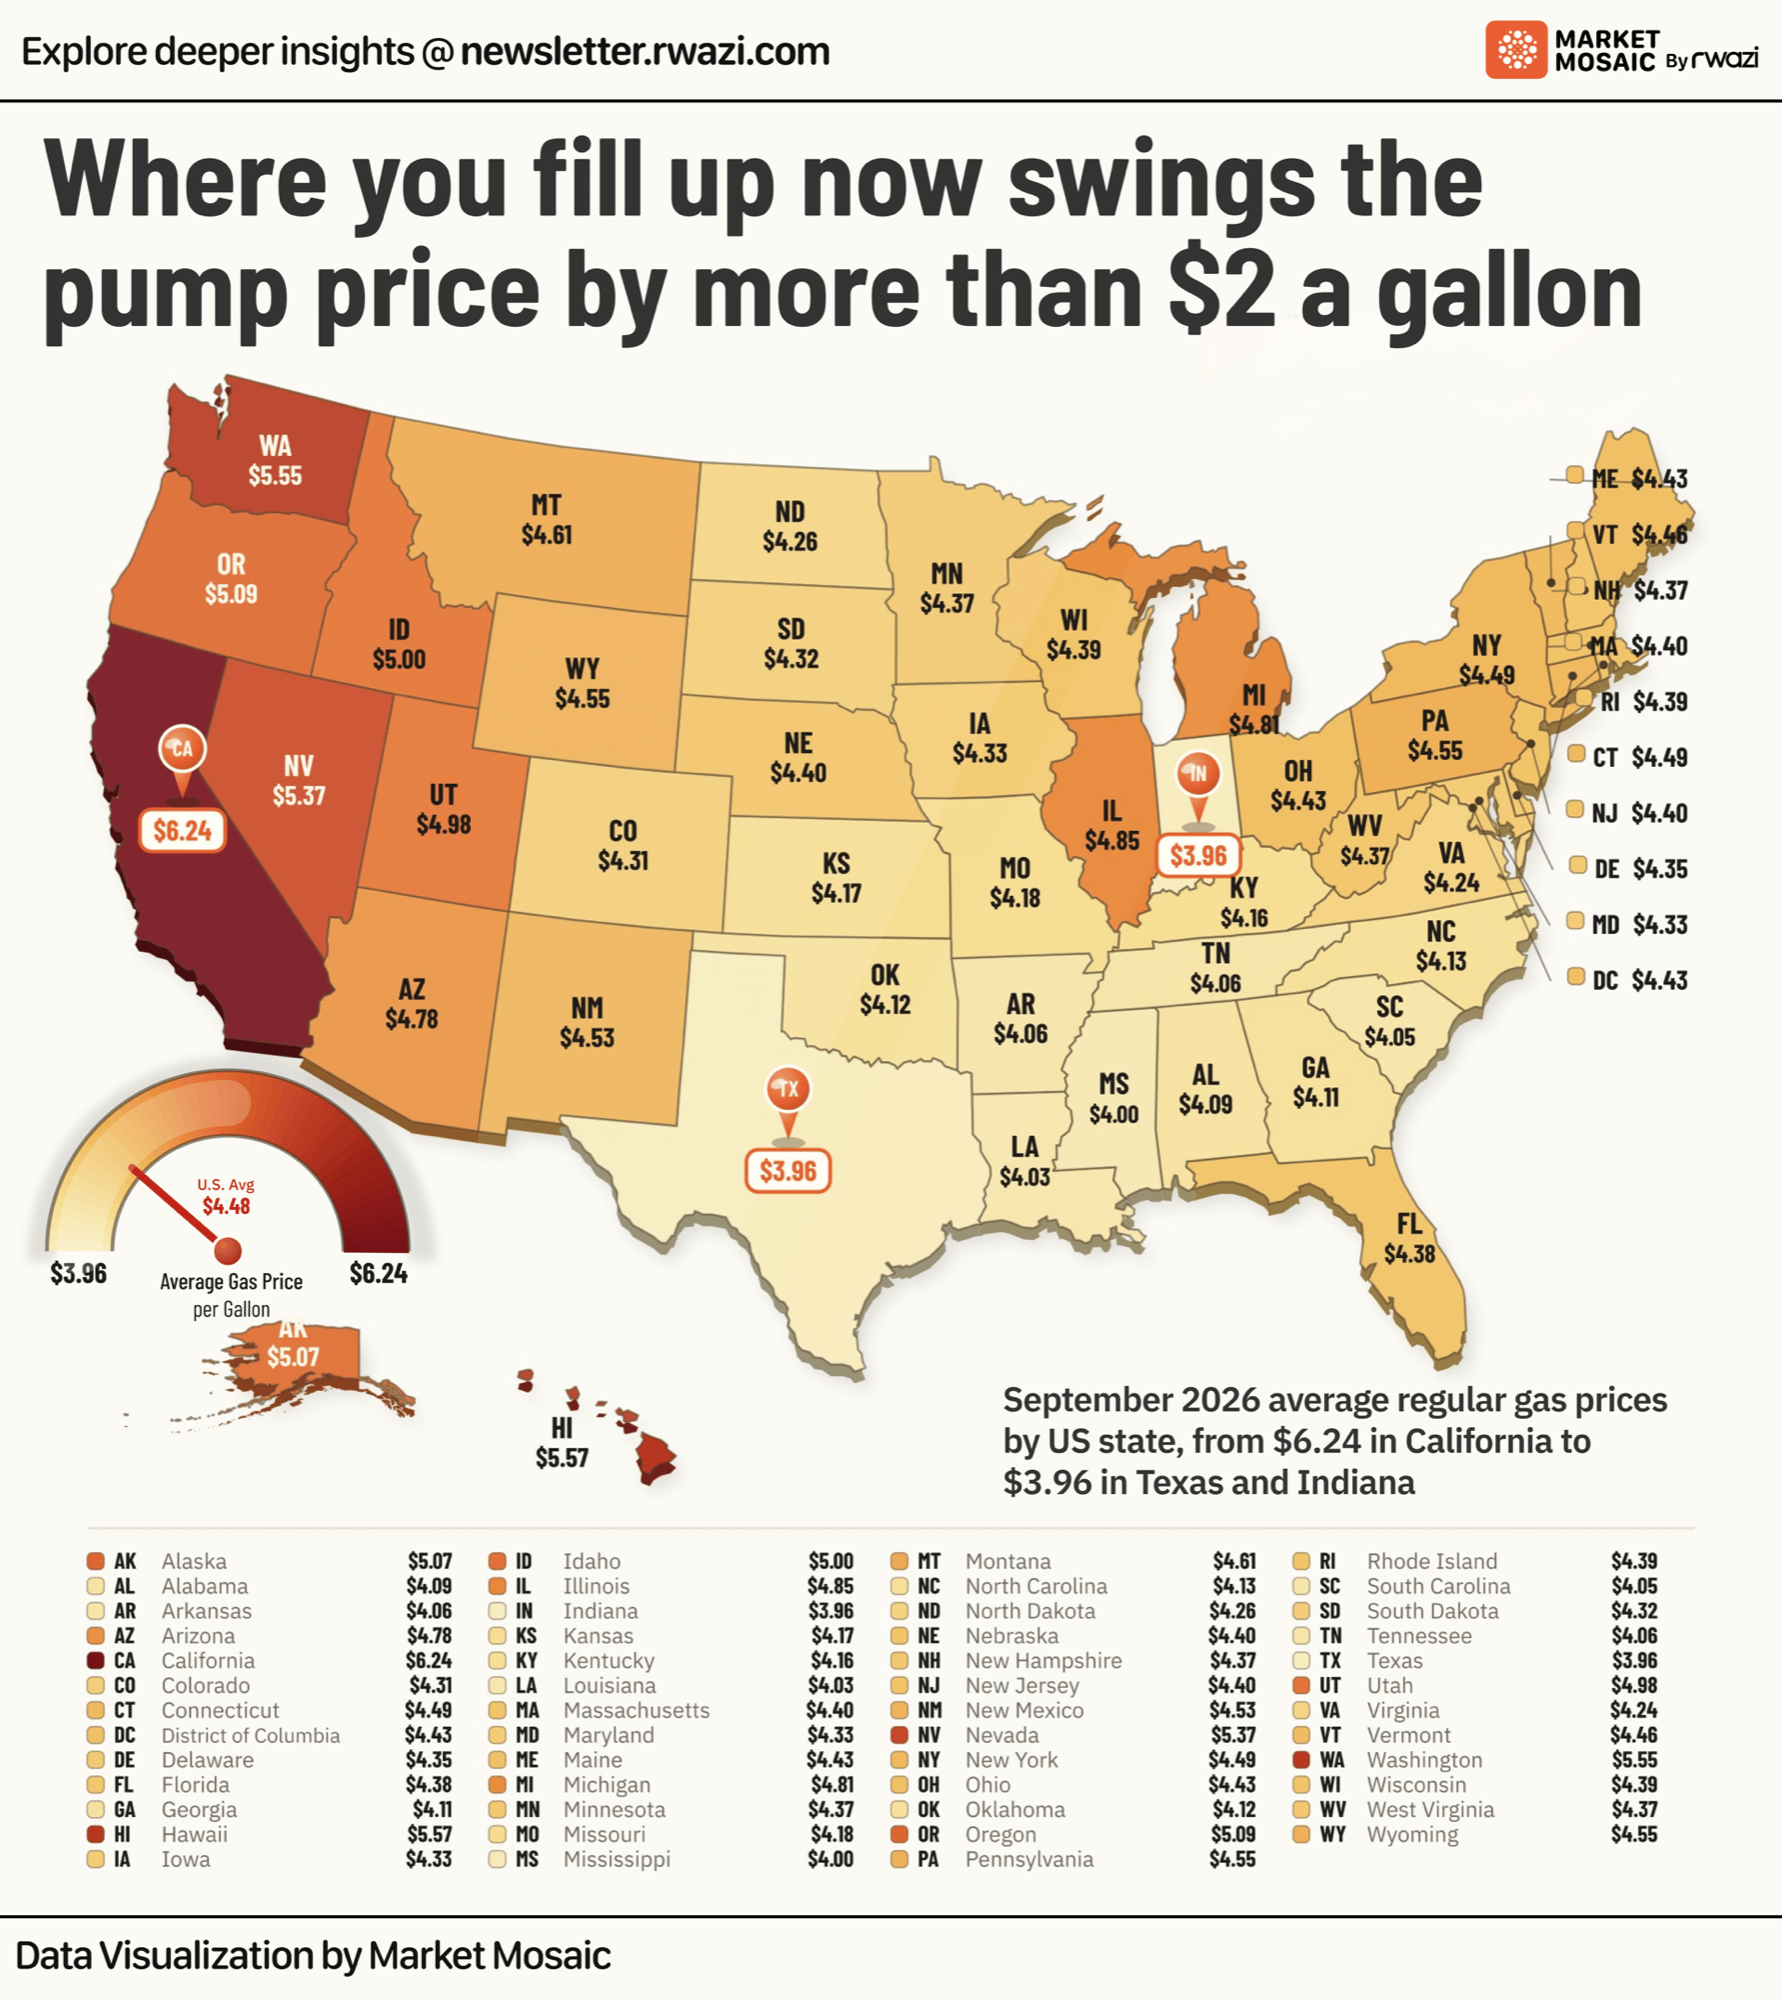
Gasoline averaged $6.24 a gallon in California and $3.96 in Texas and Indiana in September
California averaged $6.24 a gallon in September, 58% above the $3.96 paid in Texas and Indiana, a $2.28 gap. Seven states averaged $5.00 or more, all in the West. The median across the 50 states and DC was $4.39, with 15 averaging $4.50 or more. That spread comes as national gasoline prices sit…
 ChartEdition #137
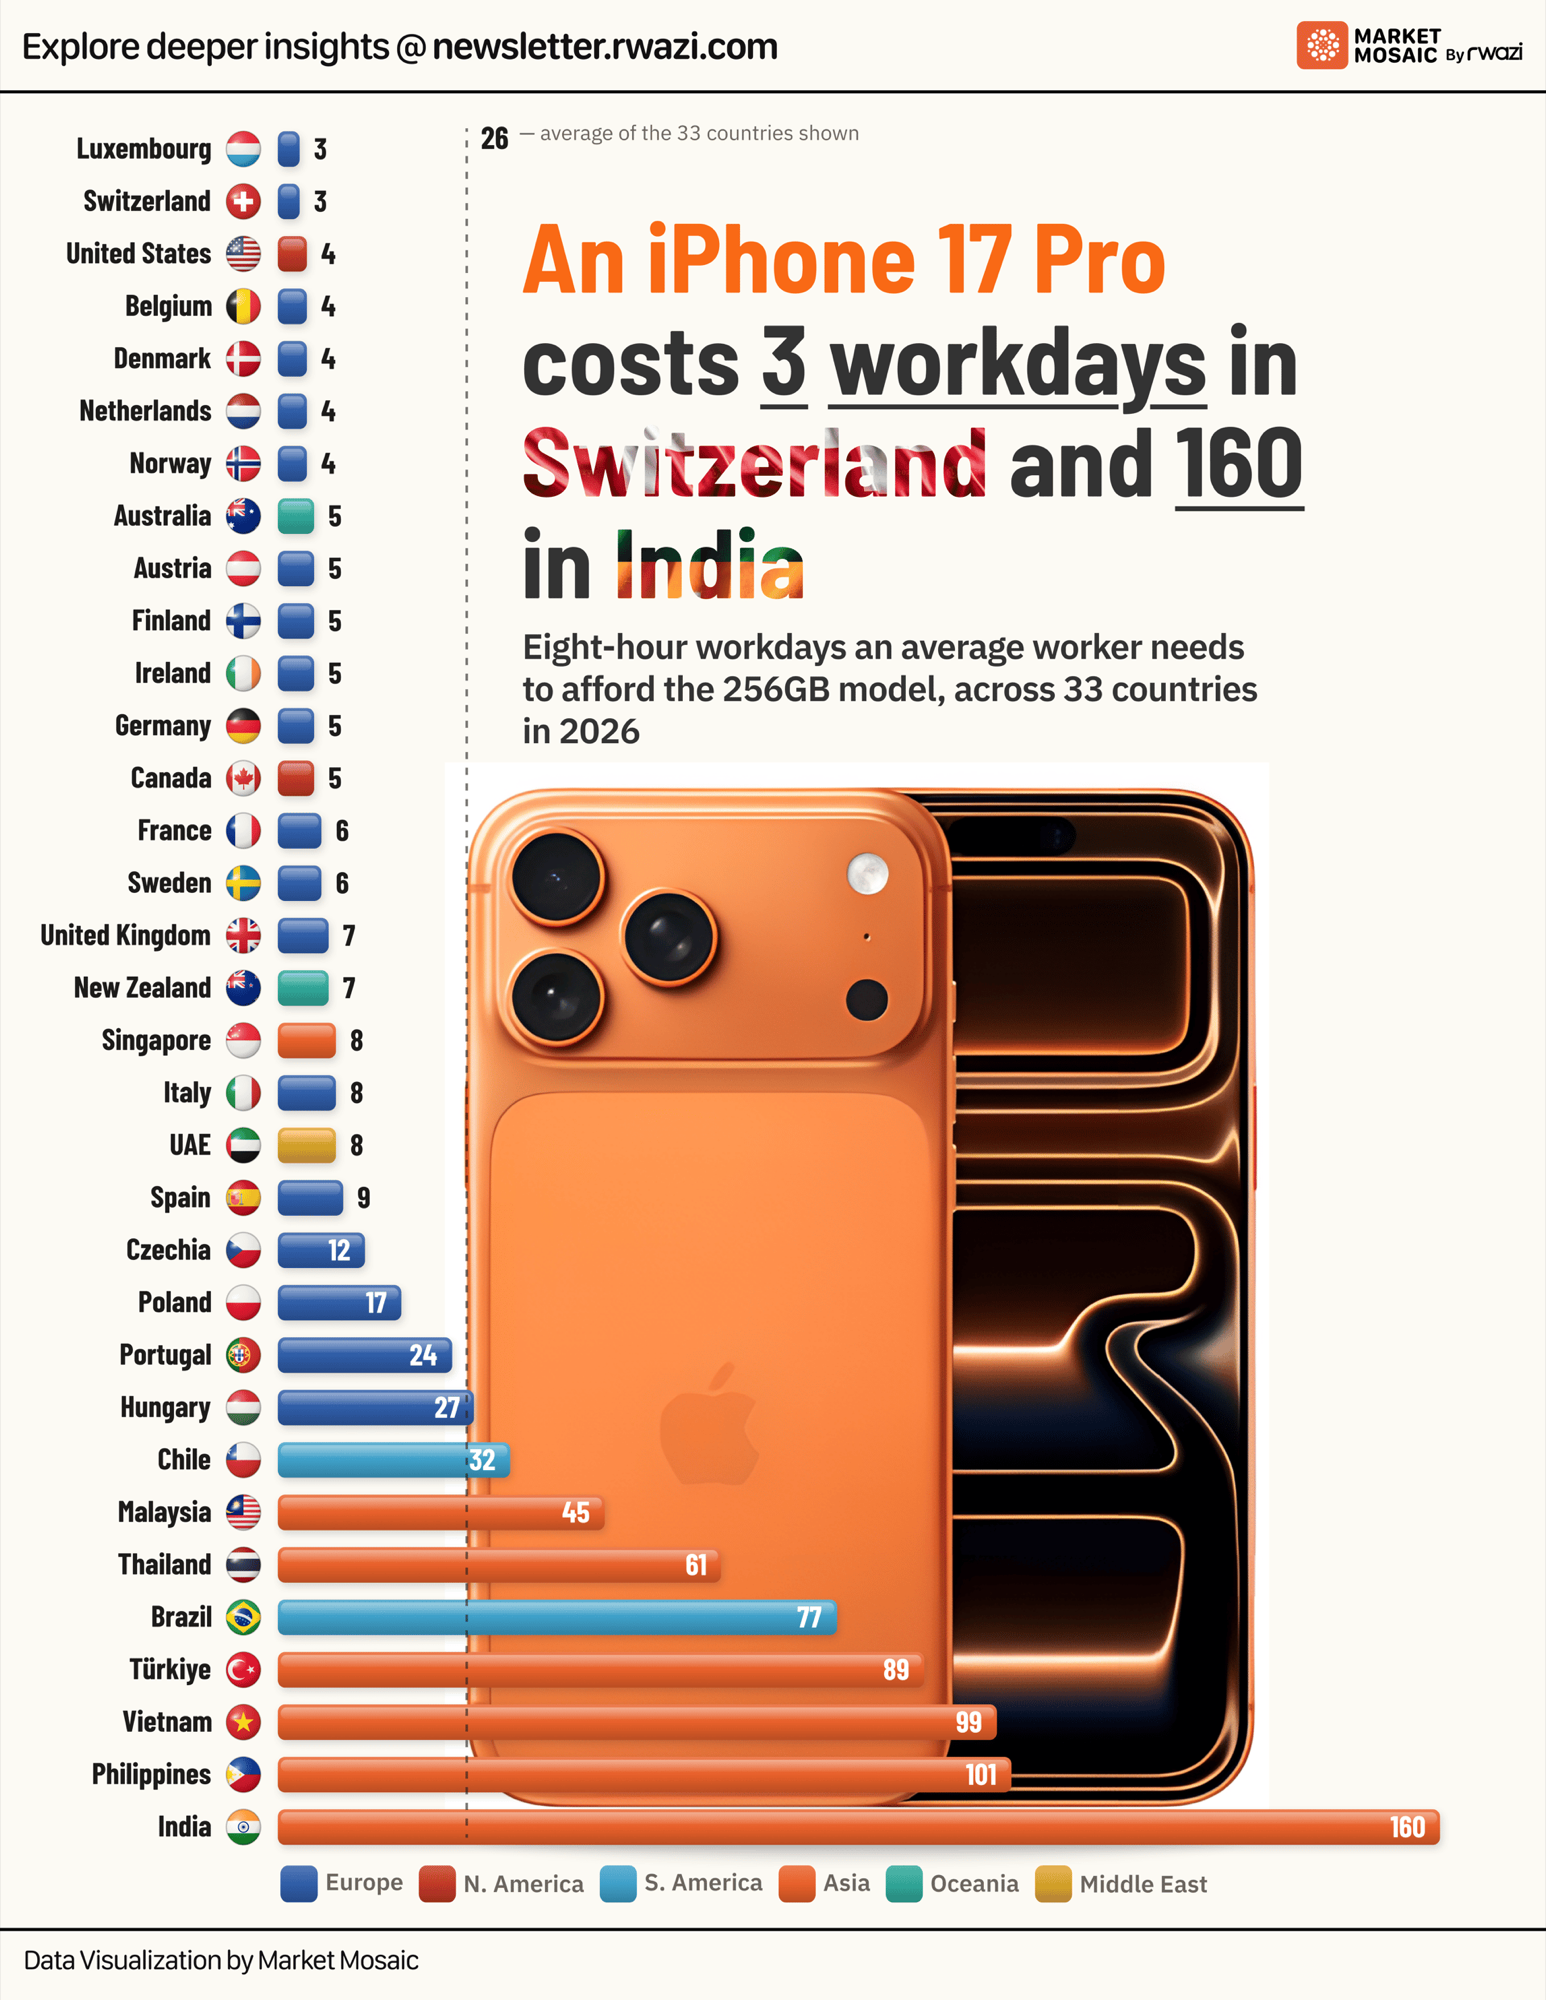
A flagship smartphone costs 3 workdays of pay in Switzerland and 160 in India
An average worker needs just 3 eight-hour workdays of pay to afford a flagship 256GB smartphone in Luxembourg and Switzerland, 4 in the US, and 5 in Germany and Canada. Across 33 countries, the gap stretches to 160 workdays in India. Emerging markets sit far higher, at 101 workdays in the…
 ChartEdition #134
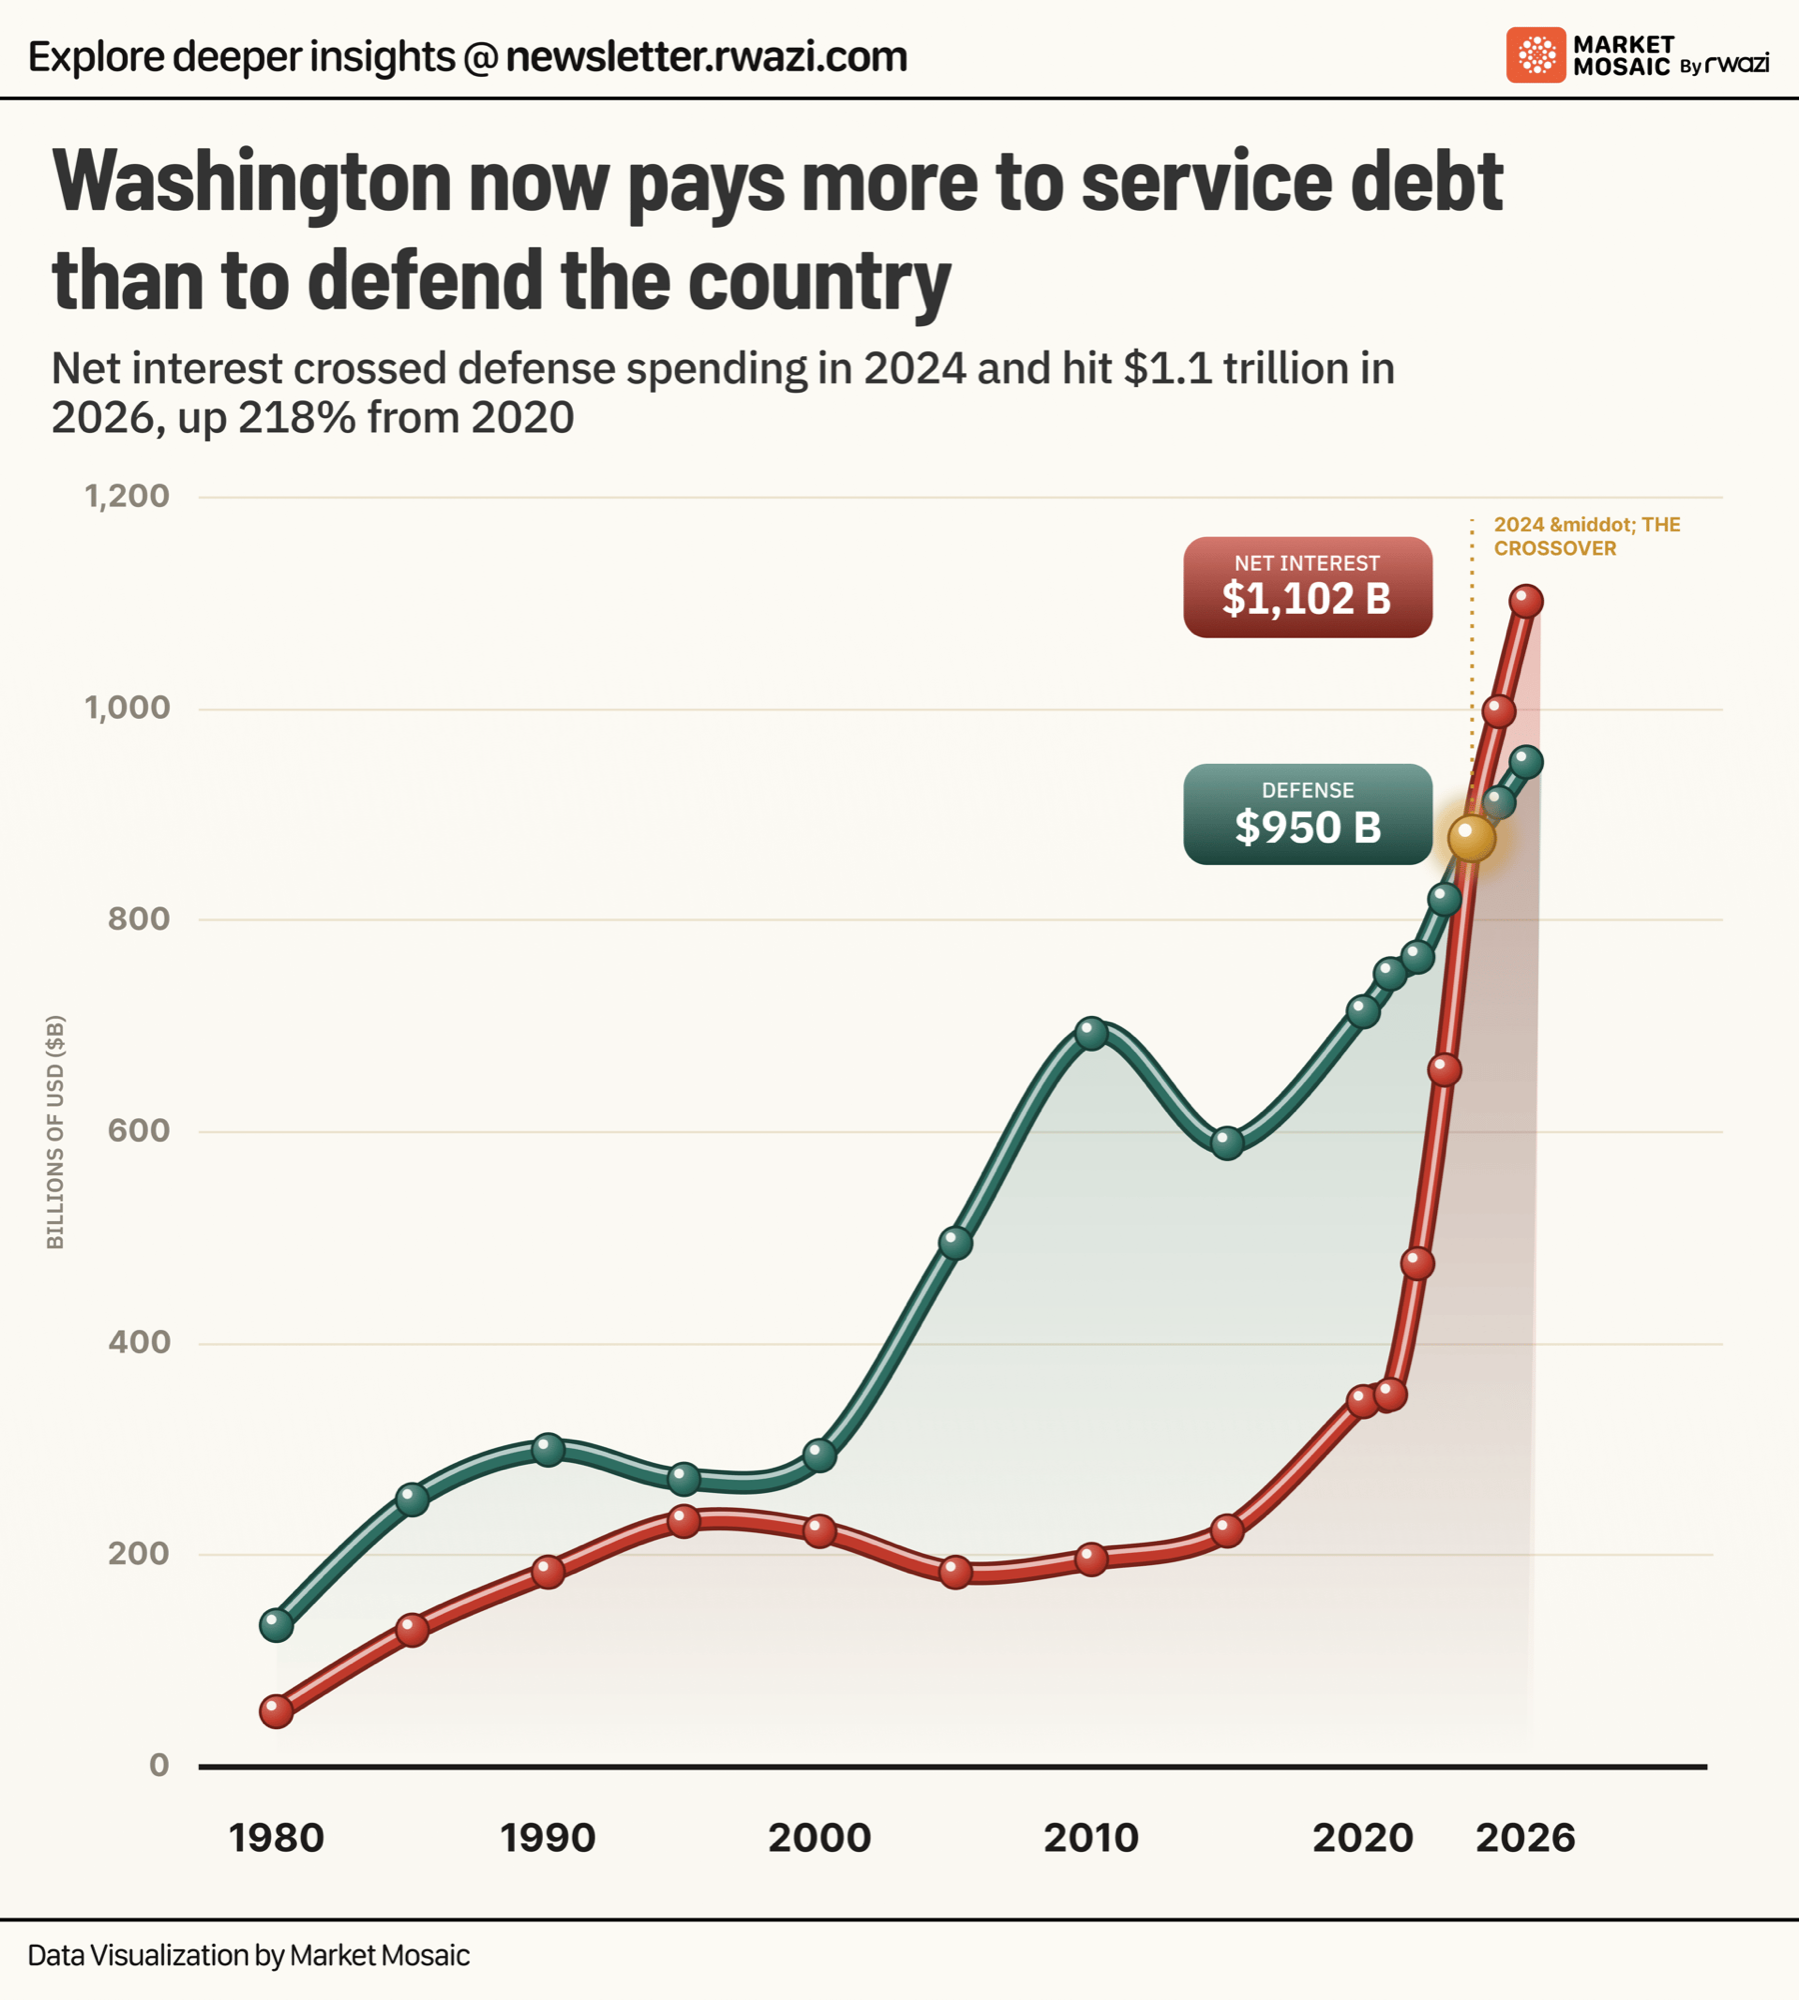
Washington now pays more to service its debt than to defend the country
Net interest payments hit $1,102 billion in 2026, up 218% from $345.5 billion in 2020. That figure first exceeded defense spending in 2024, when interest costs reached $882 billion, compared with $874 billion in defense outlays. Defense spending kept climbing too, reaching $950 billion in 2026, but…
 ChartEdition #130
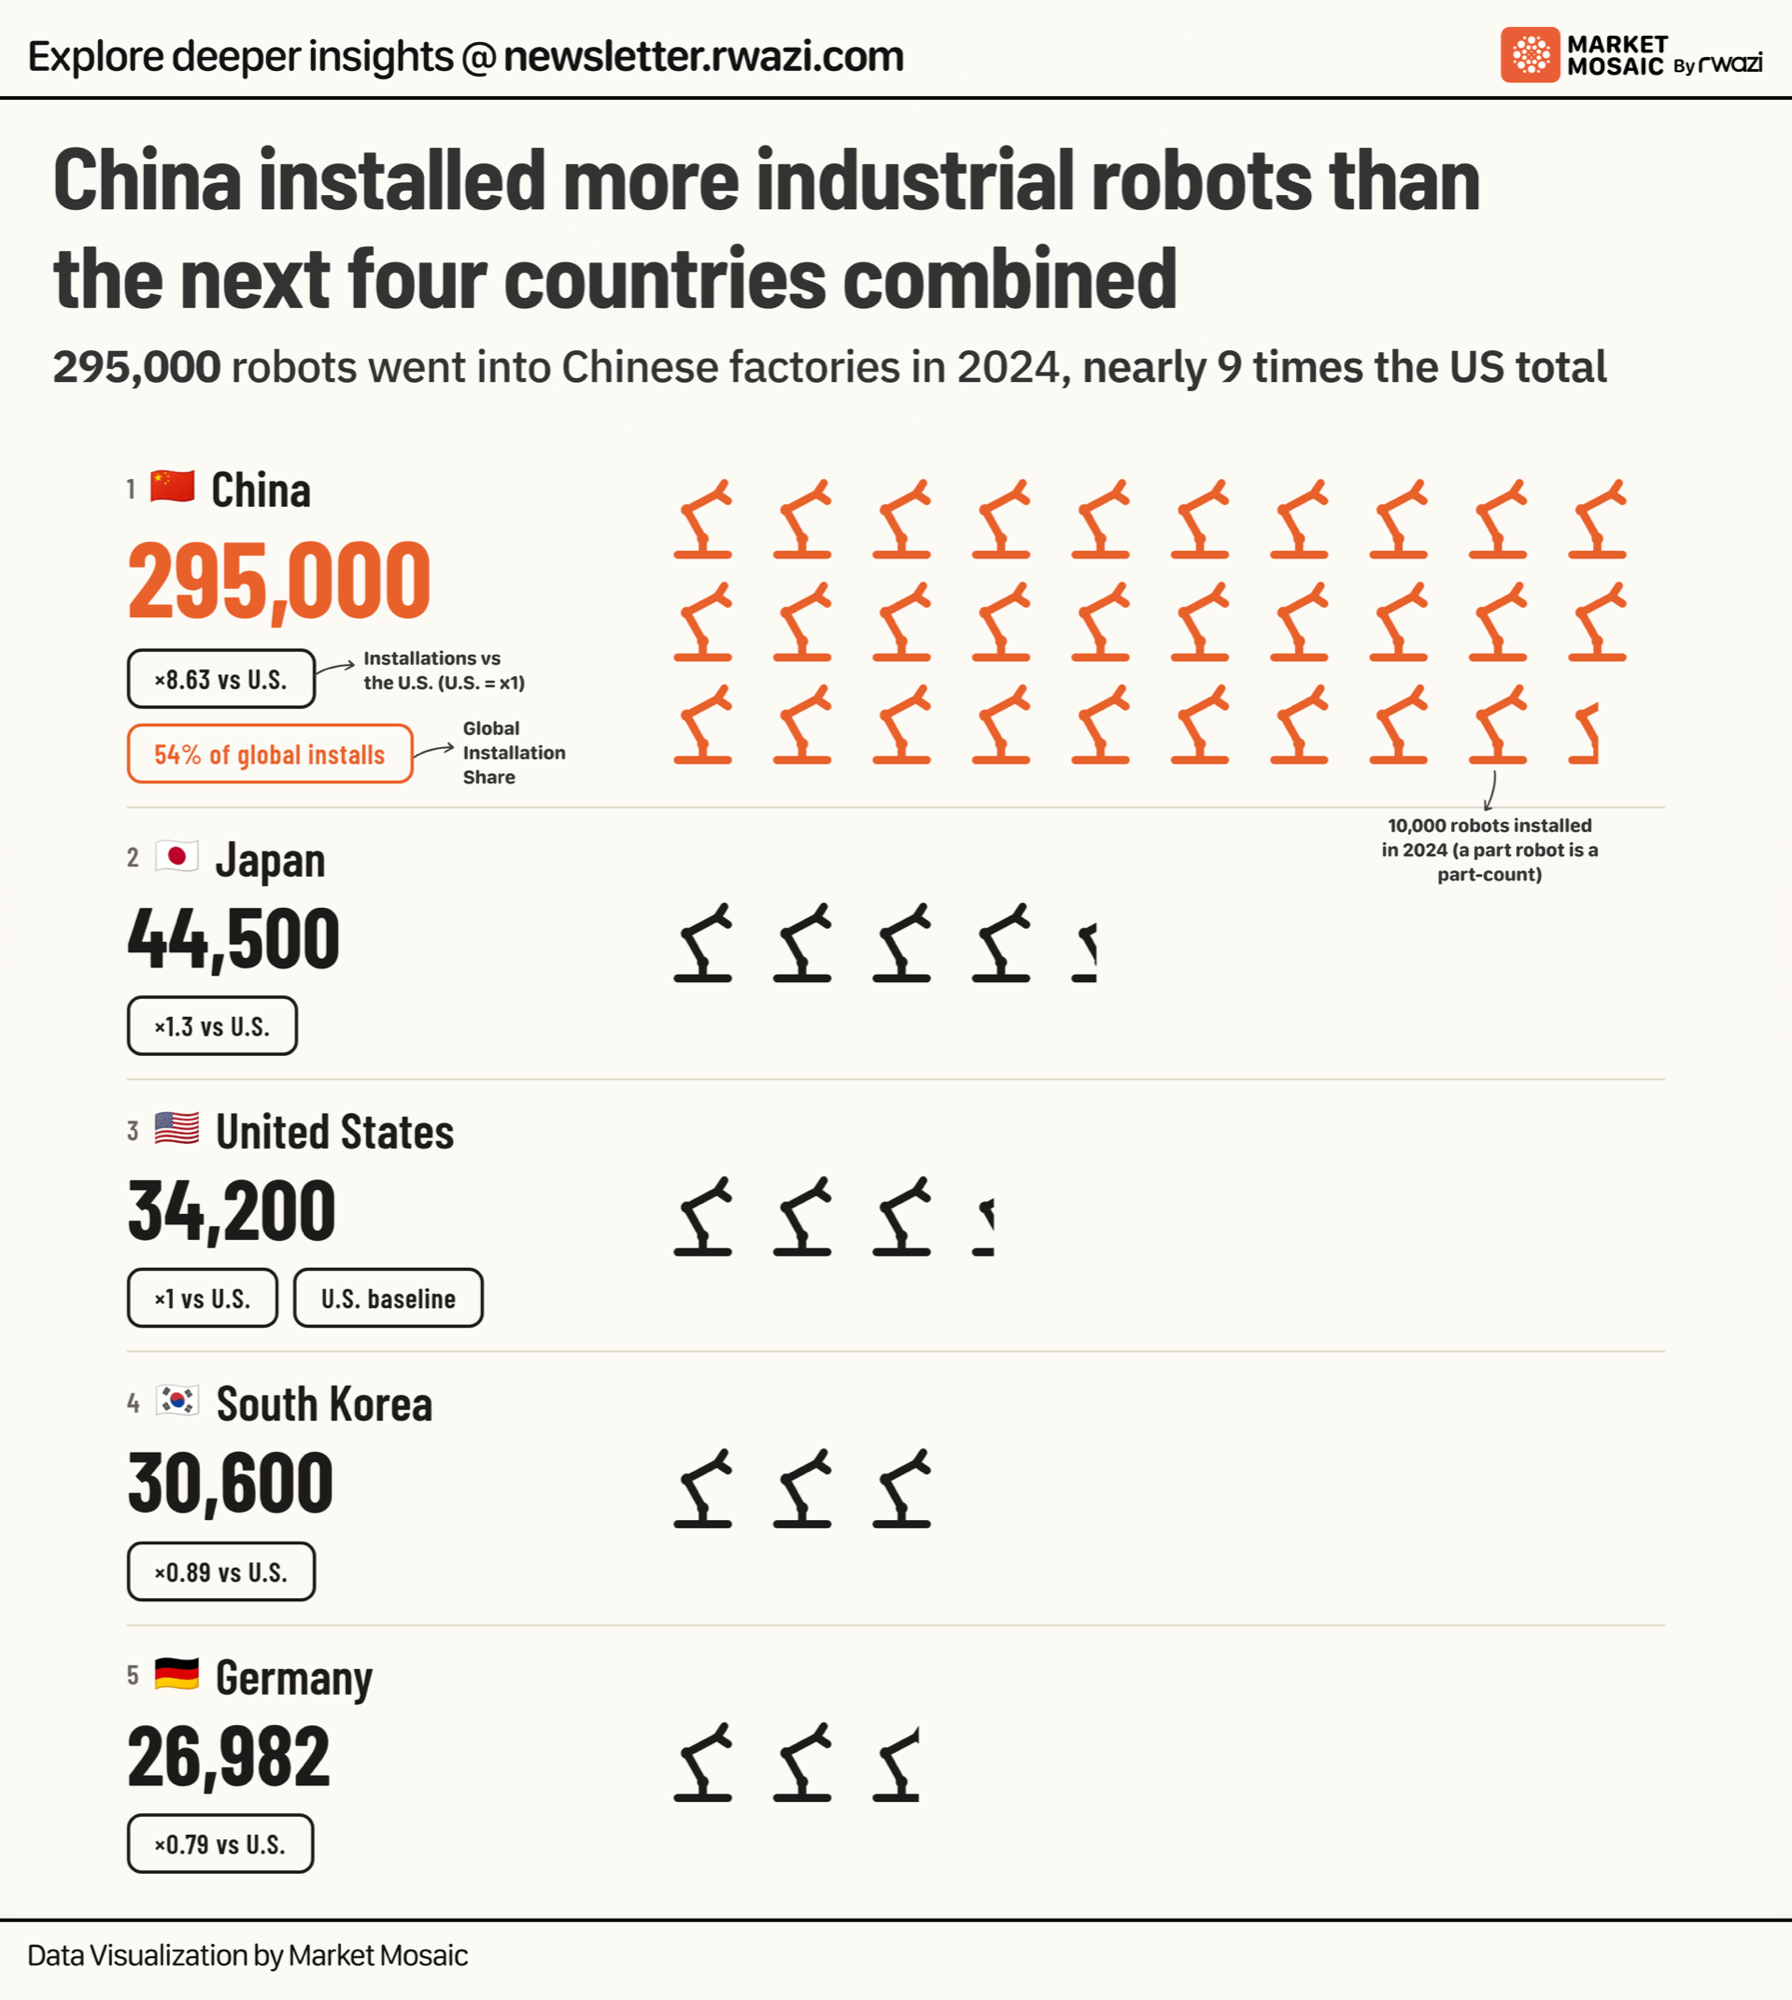
China installed more industrial robots than the next 4 countries combined
China put 295,000 industrial robots to work in factories in 2024, more than Japan, the United States, South Korea, and Germany combined. That single-year total amounts to 8.63 times the US figure and 54% of all robots installed worldwide. Japan held onto 2nd place with 44,500 installations, while…
 ChartEdition #129
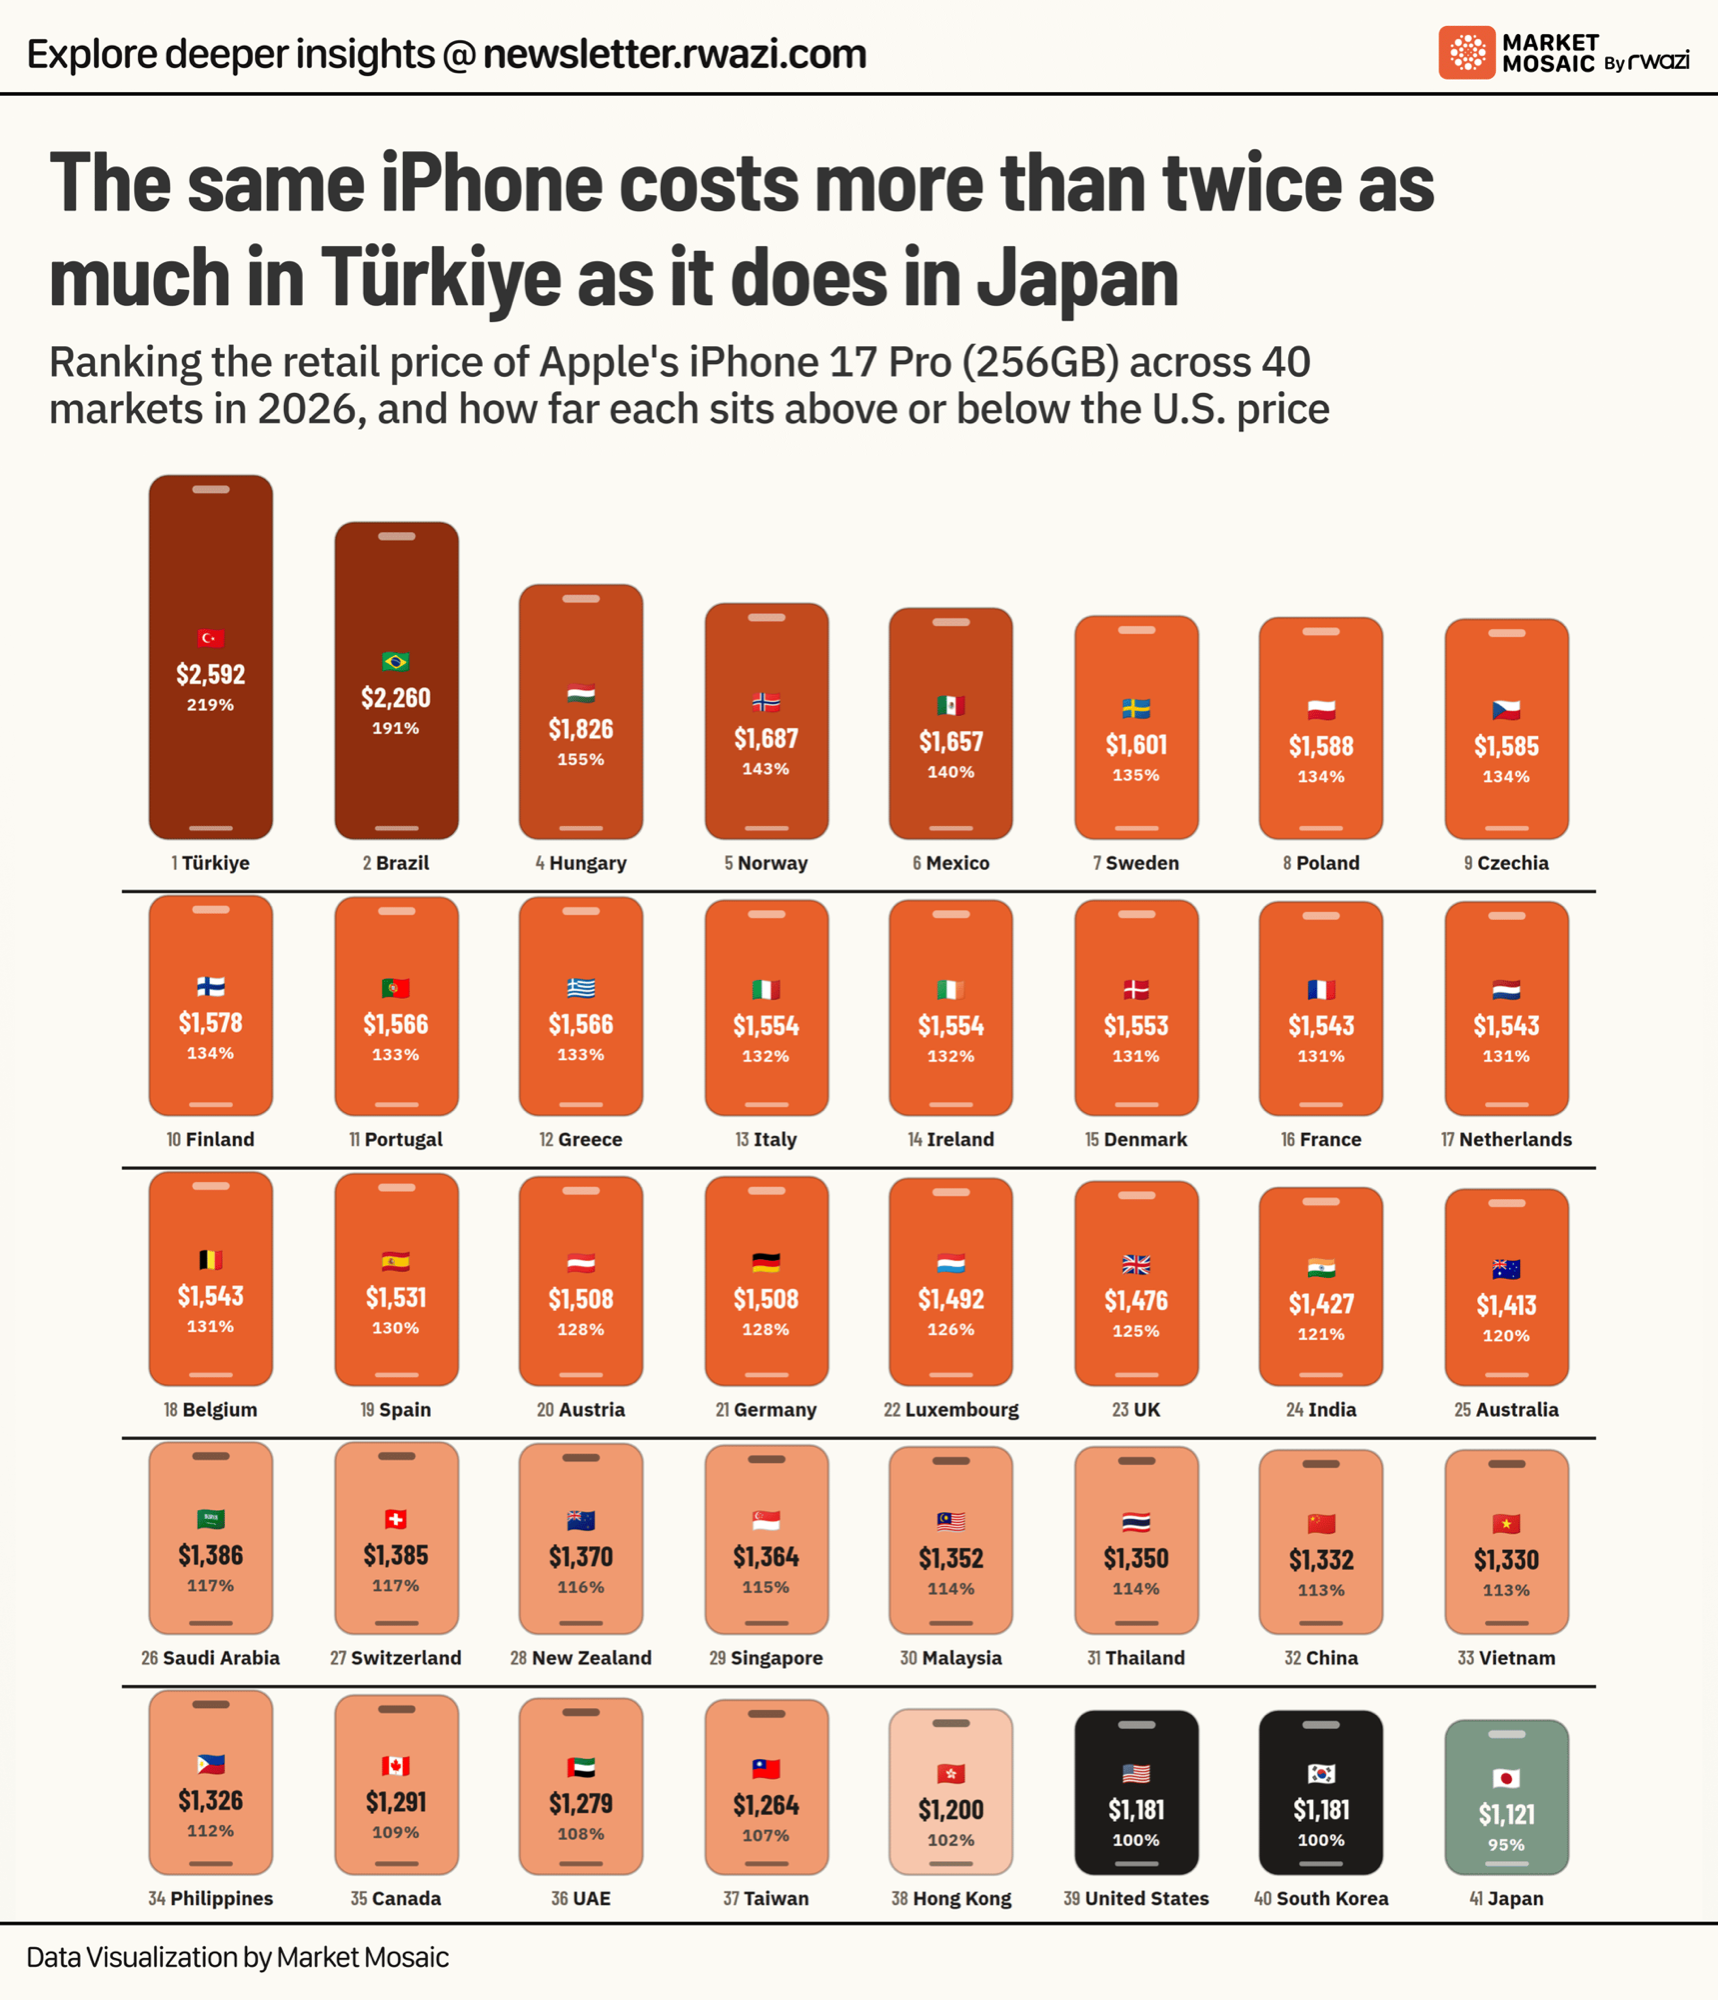
A 256GB smartphone costs twice as much in Türkiye as it does in Japan
A 256GB flagship smartphone costs $2,592 in Türkiye, 119% above the $1,181 U.S. price and the highest of 40 markets tracked. Brazil follows at $2,260, 91% above the U.S. price, and Hungary rounds out the top 3 at $1,826, 55% higher. Japan is the only market cheaper than the U.S., at $1,121, 5%…
 ChartEdition #128
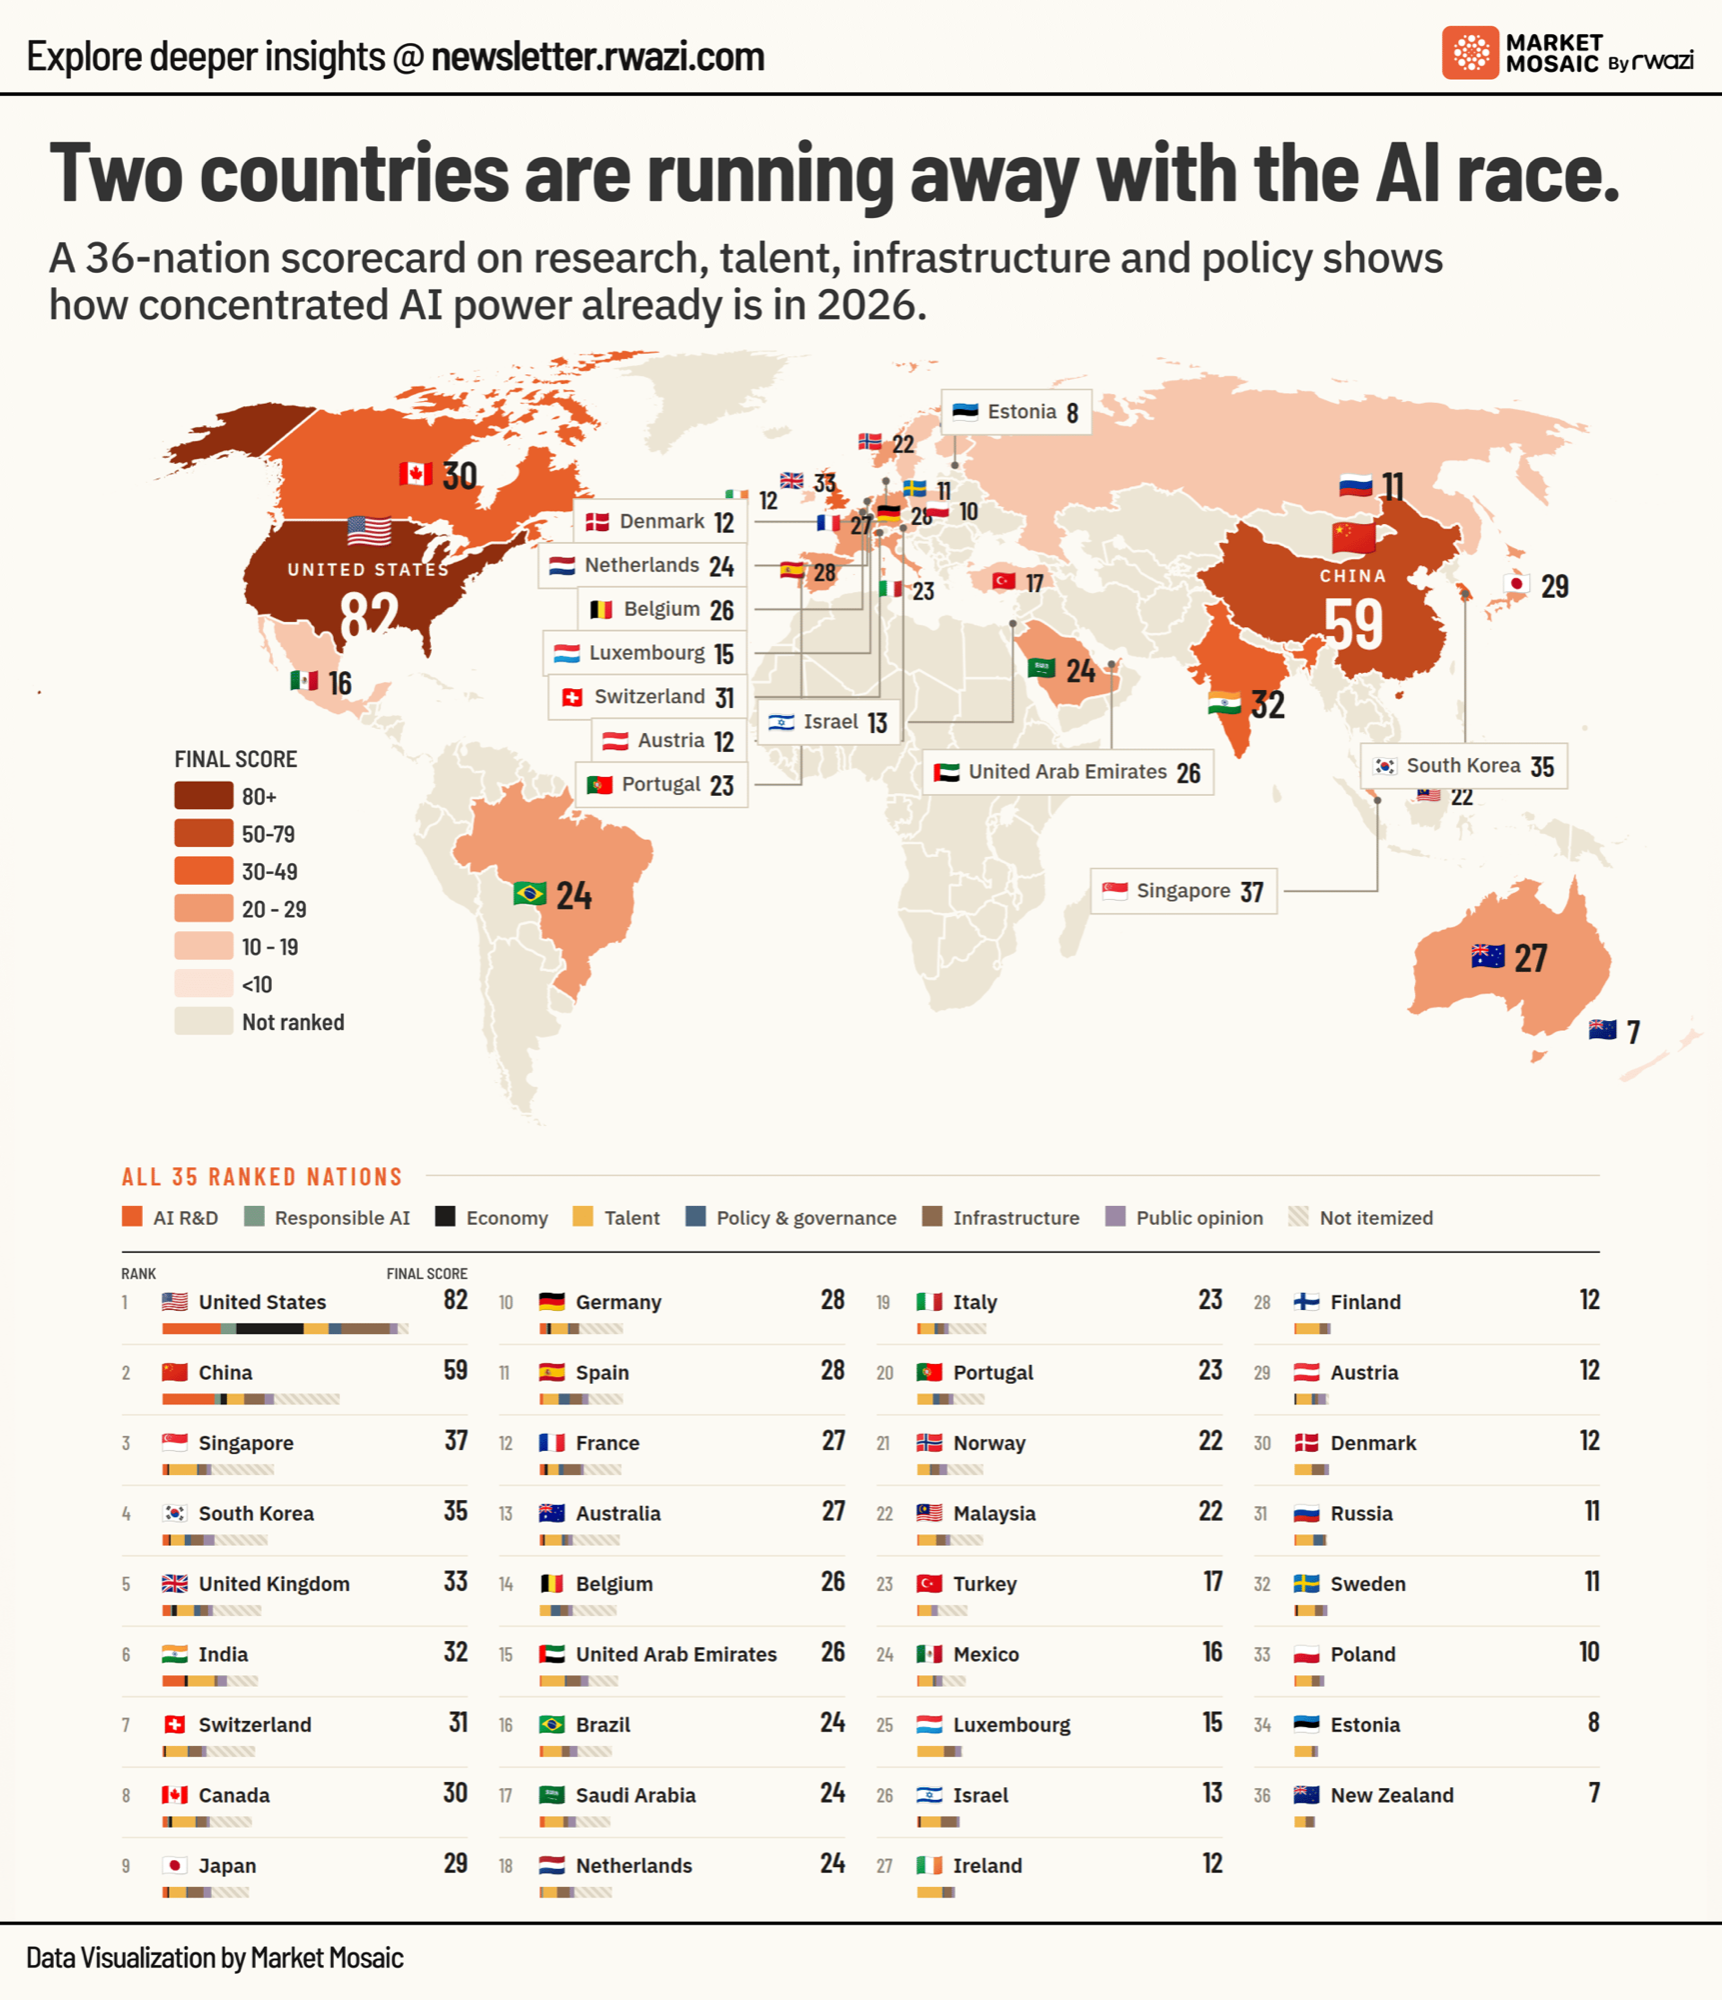
2 countries are running away with the global AI race
The US leads a 36-nation AI competitiveness scorecard with a score of 82, built on R&D output, computing infrastructure, and policy support. China trails at 59, 23 points behind, while every other nation scores below 40. China counts 107 top-ranked AI university programs versus 26 in the US, yet…
 ChartEdition #128
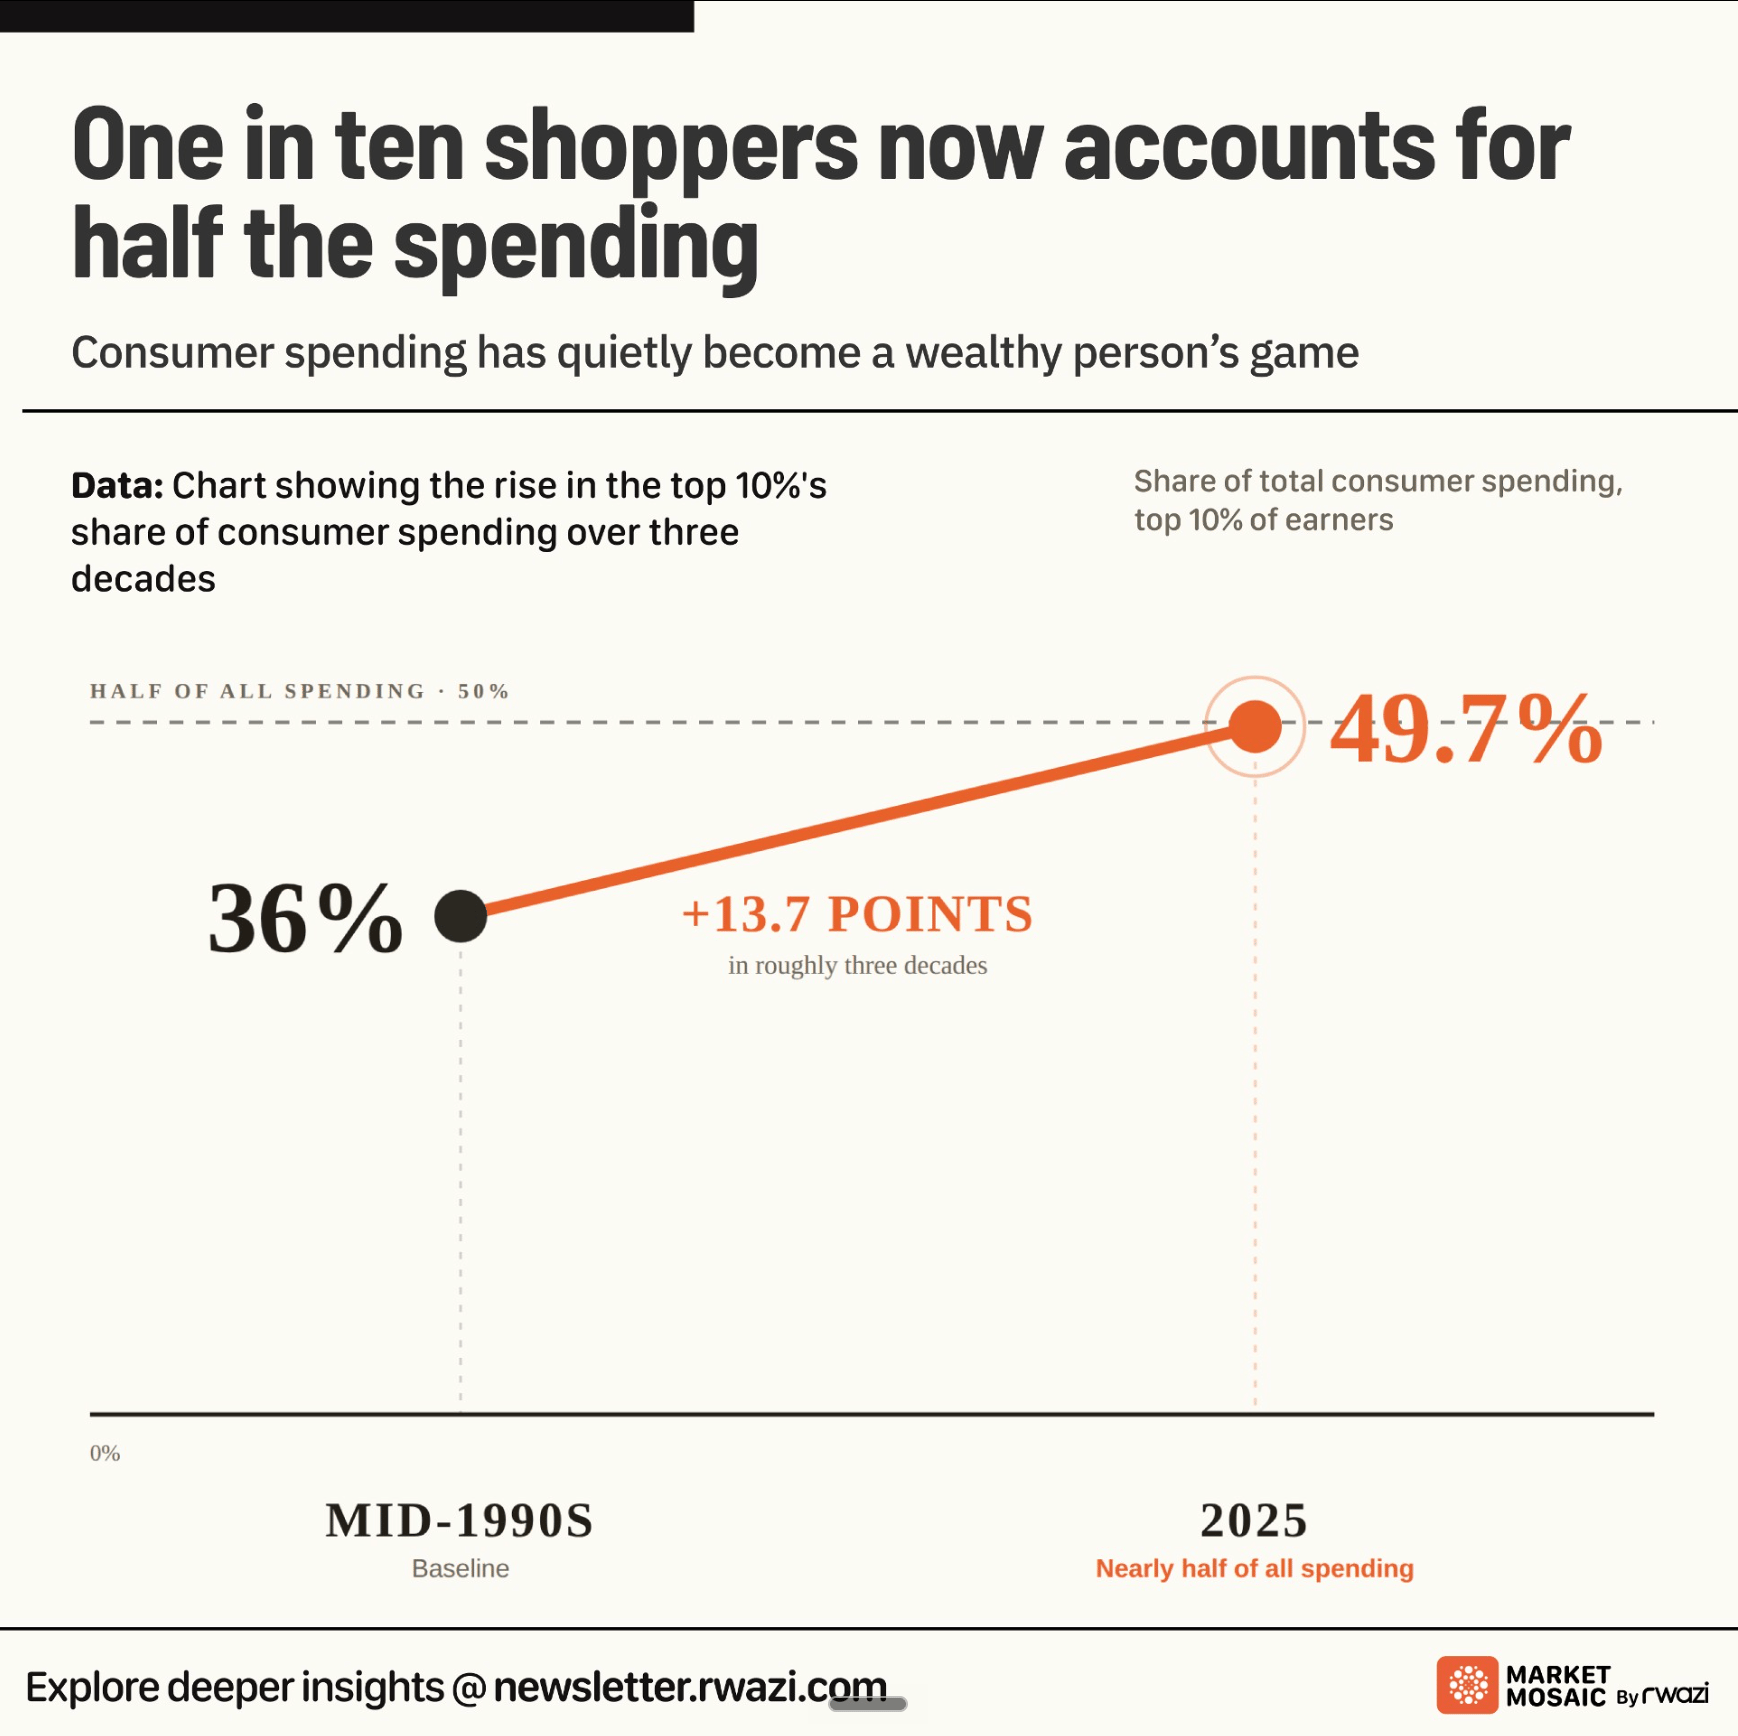
2 countries are already running away with the global AI race
 ChartEdition #127
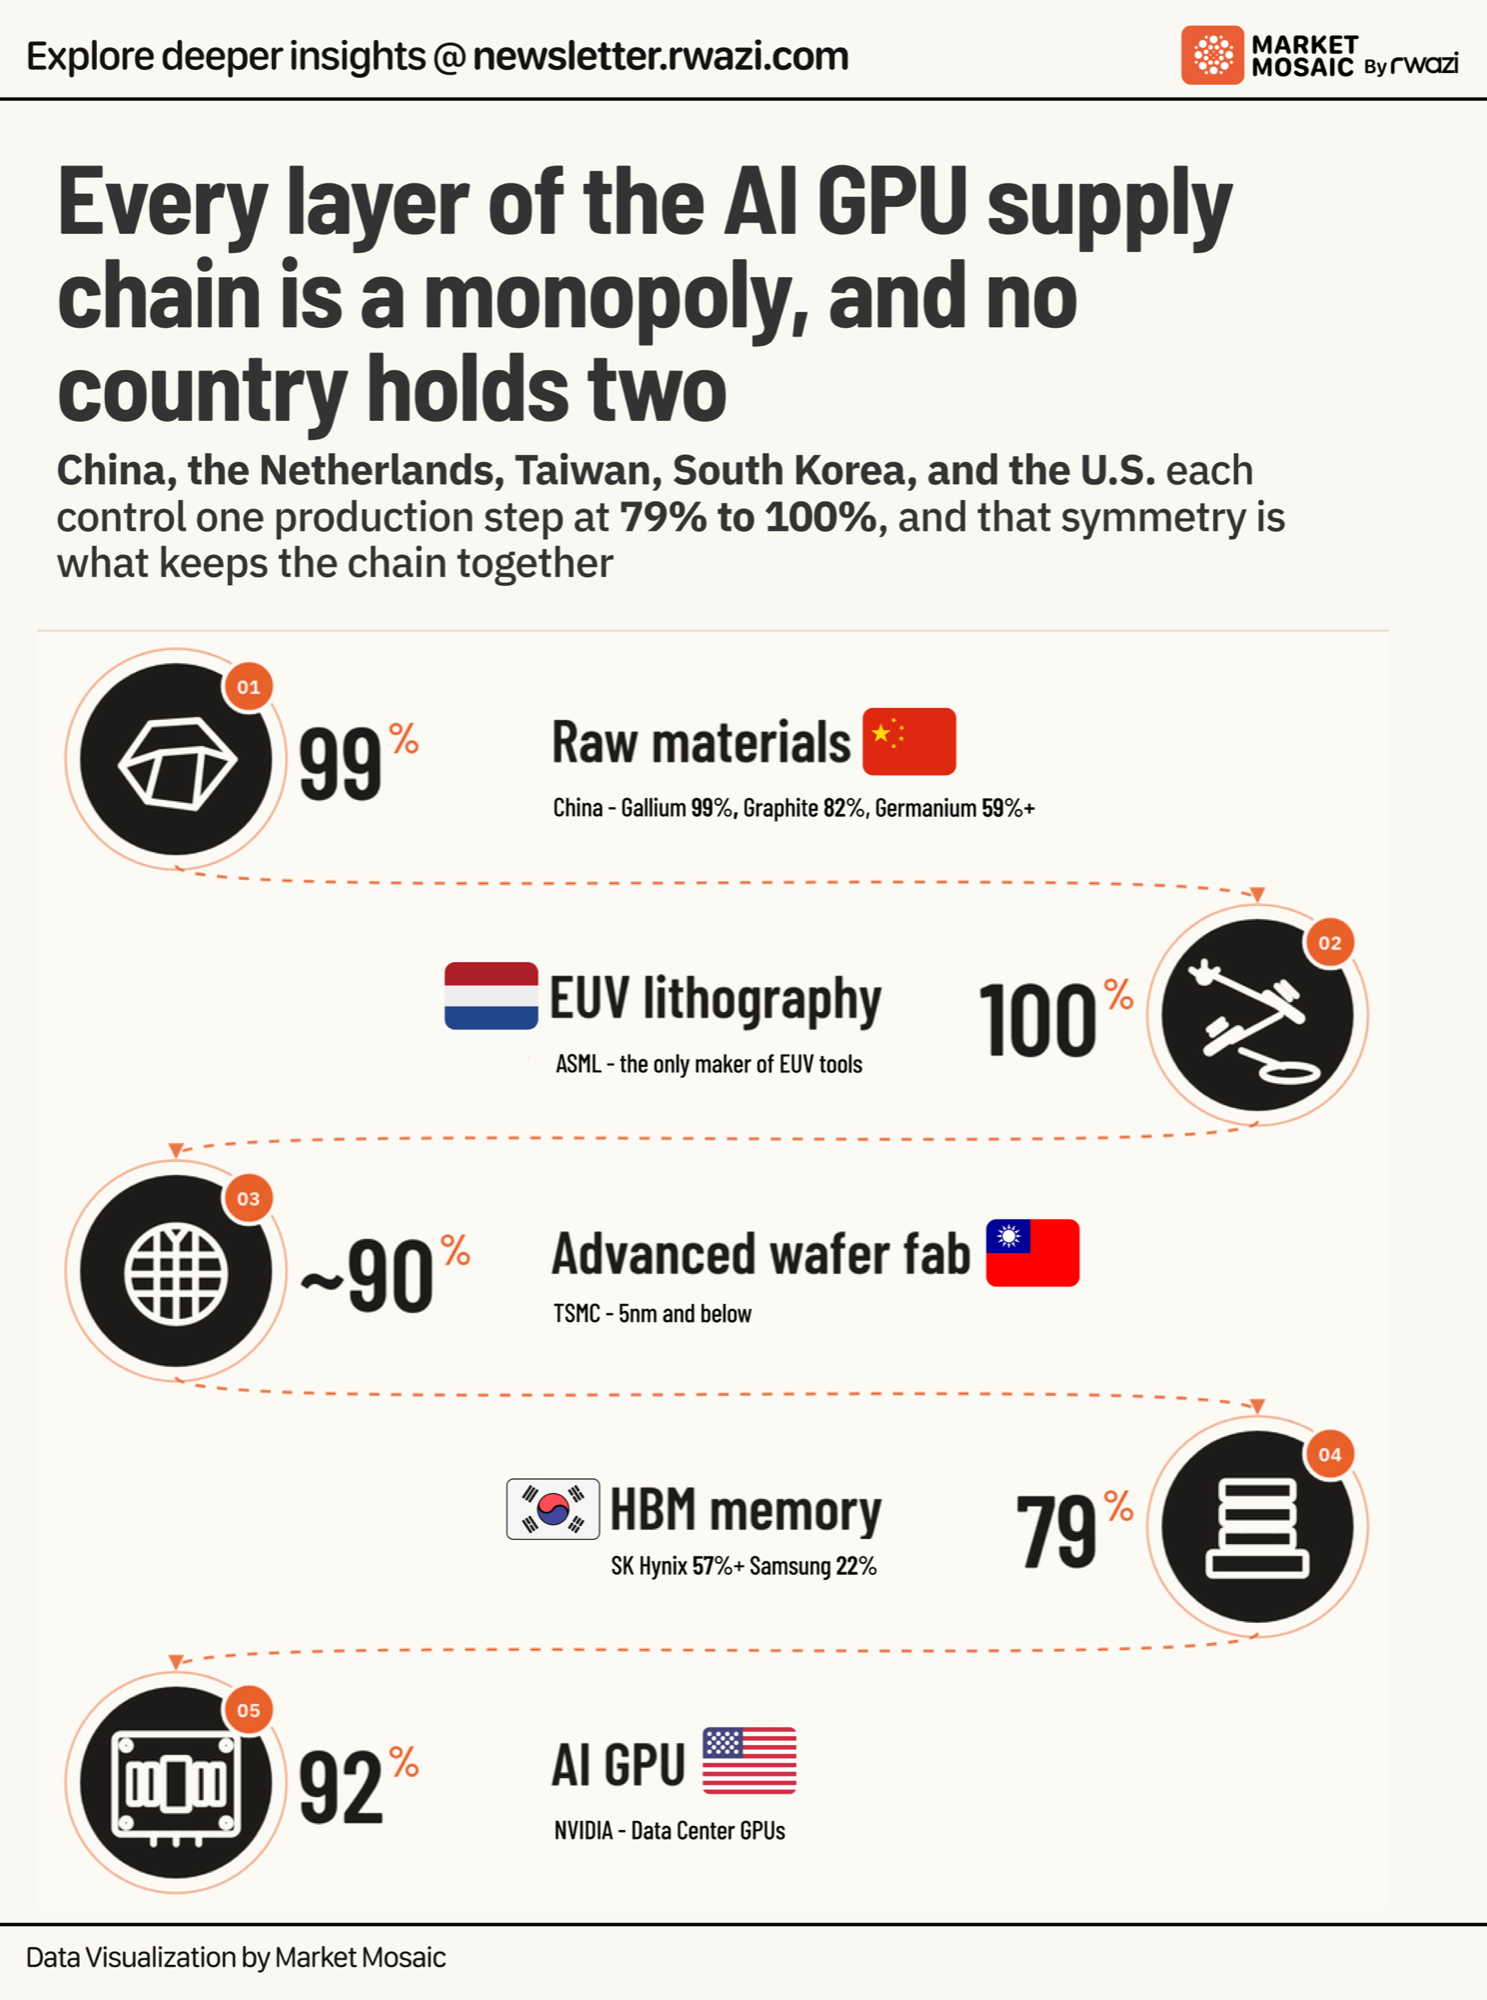
5 countries each hold a monopoly link in the AI chip supply chain
China refines 99% of the world's low-purity gallium and 82% of its natural graphite. A single Dutch manufacturer holds 100% of the EUV lithography tool market, and Taiwan's leading foundry runs roughly 90% of global capacity at the 5-nanometer node and below. The pattern holds downstream too. South…
 ChartEdition #127
5 countries each hold a monopoly link in the AI chip supply chain
 ChartEdition #126
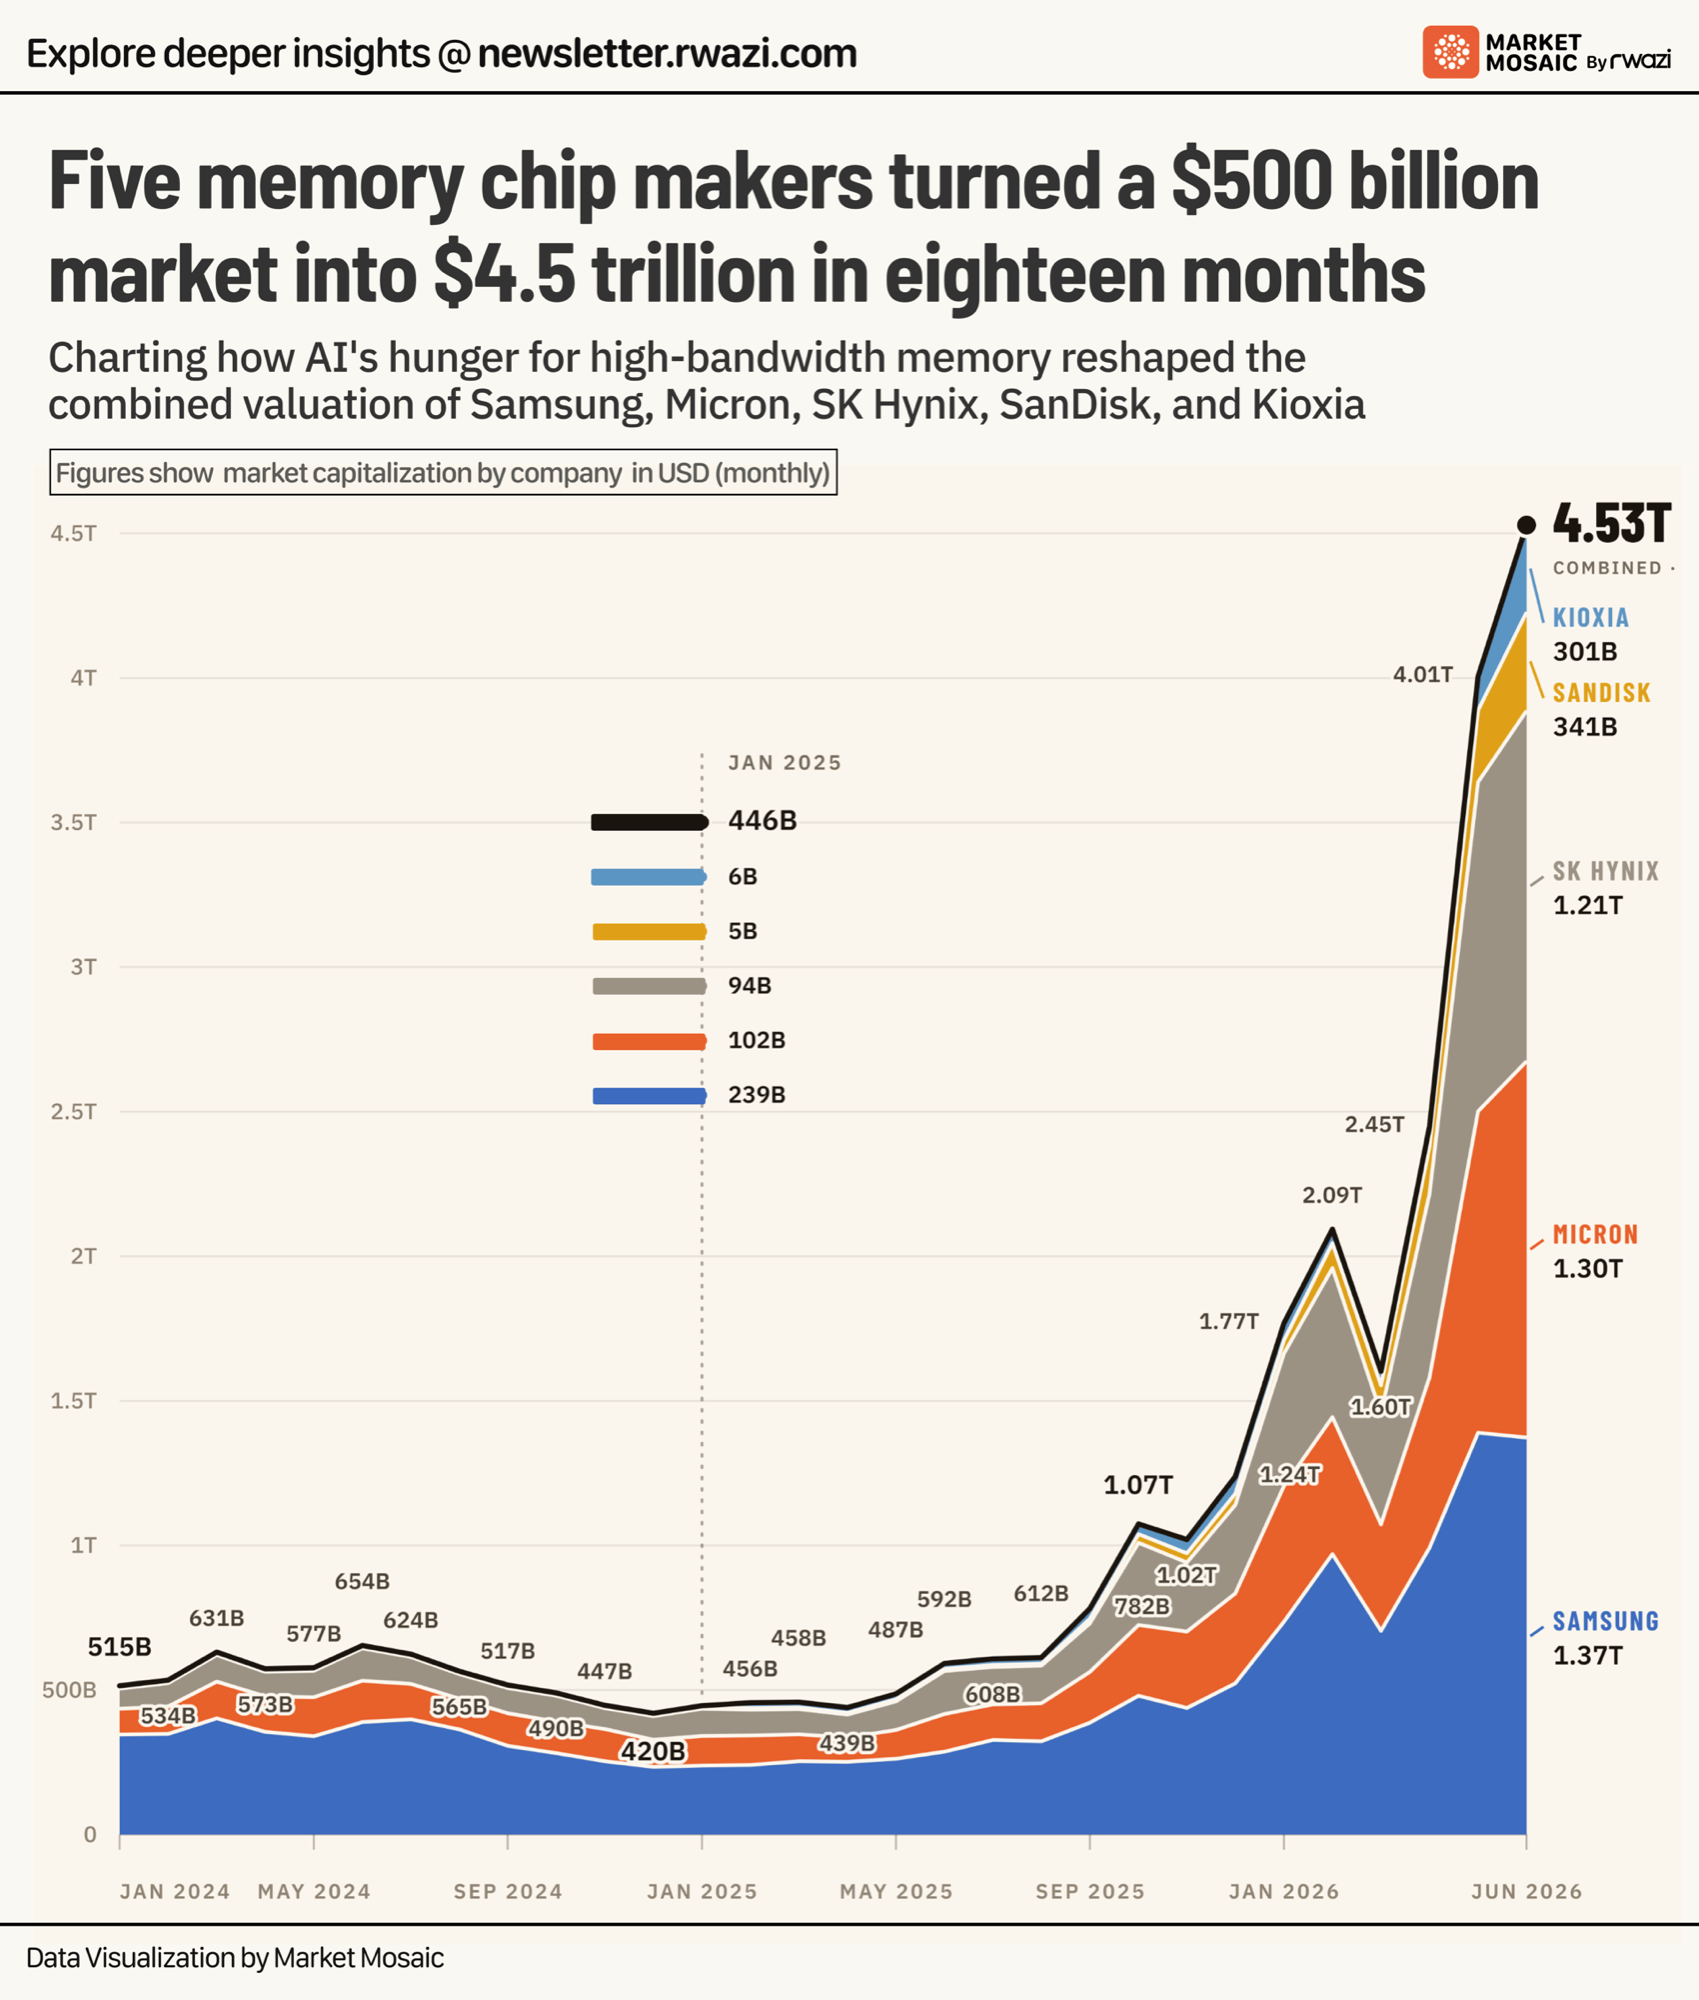
A $500 billion memory chip market is now worth $4.5 trillion
The combined market value of the world's high-bandwidth memory suppliers was near $420 billion at the end of 2024. 18 months later, that group is worth $4.53 trillion, a 10-fold jump driven almost entirely by demand for AI training and inference. The climb hasn't been smooth: values dropped 23% in…
 ChartEdition #125
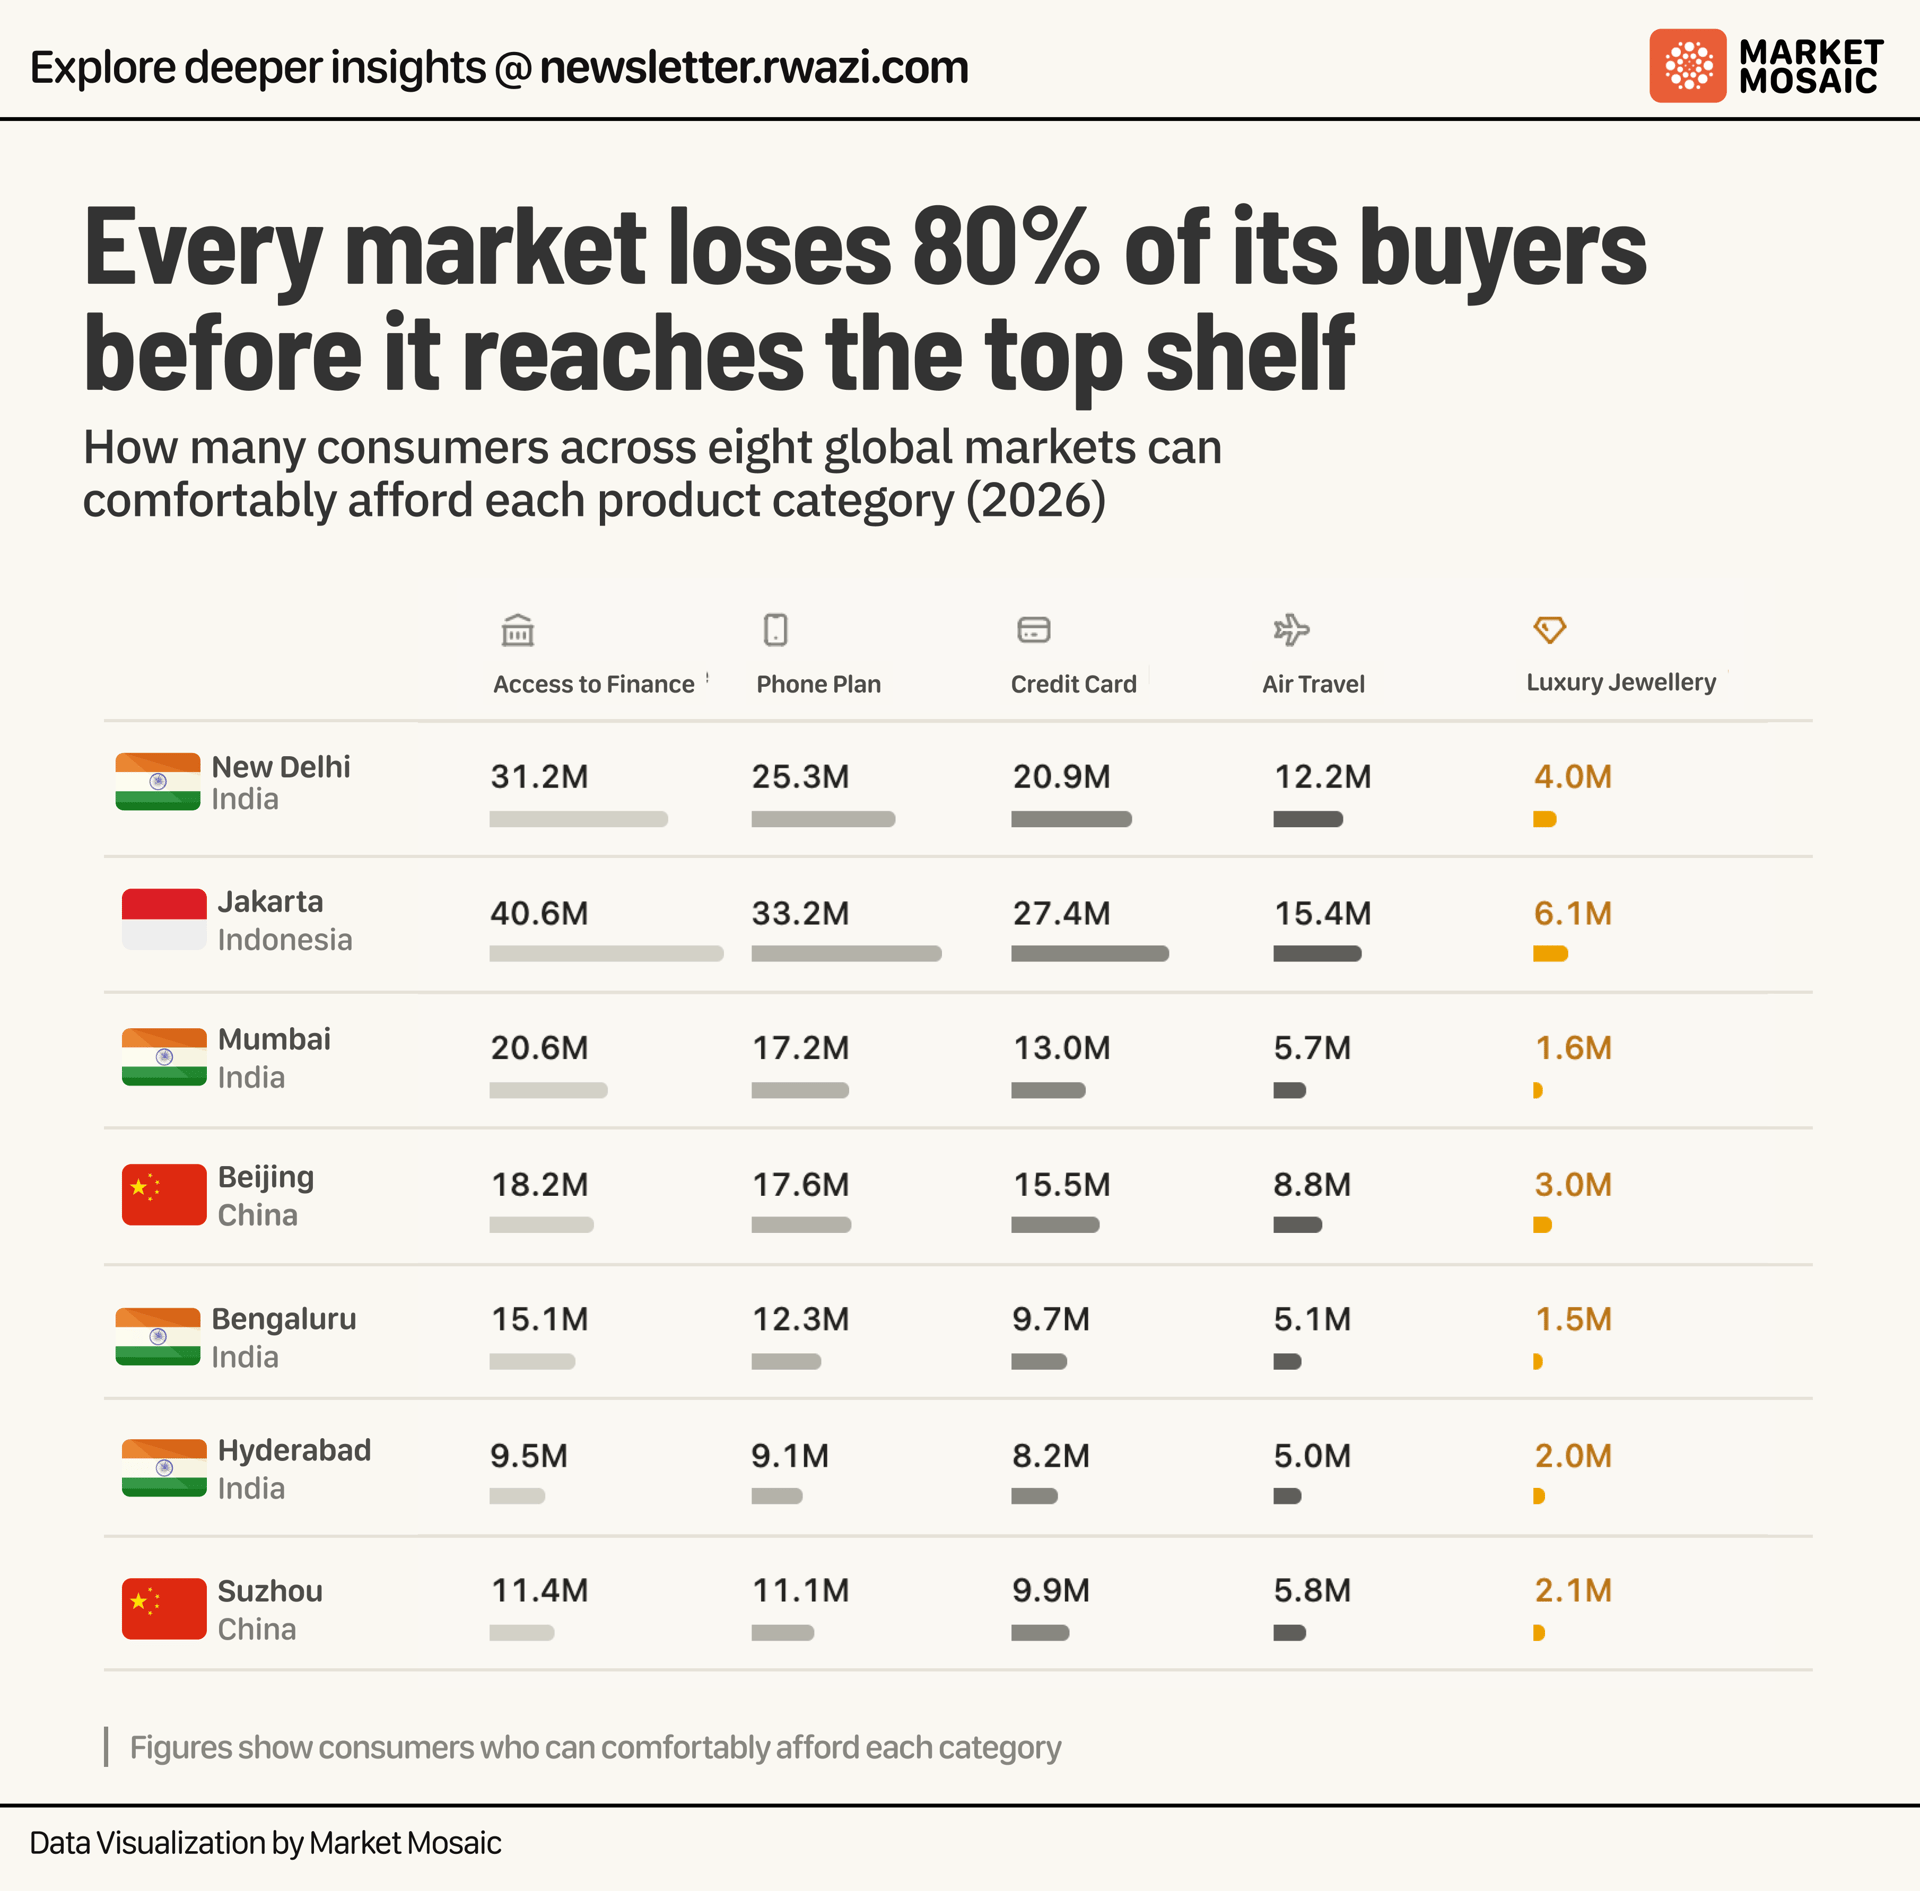
Every market loses 80% of its buyers before it reaches the top shelf
Access to a market and access to its top tier are not the same thing. Across eight major cities, people who can comfortably afford basic financial access outnumber those who can afford luxury jewellery by roughly seven to one. Jakarta has the largest base of the eight, 40.6 million residents with…
 ChartEdition #124
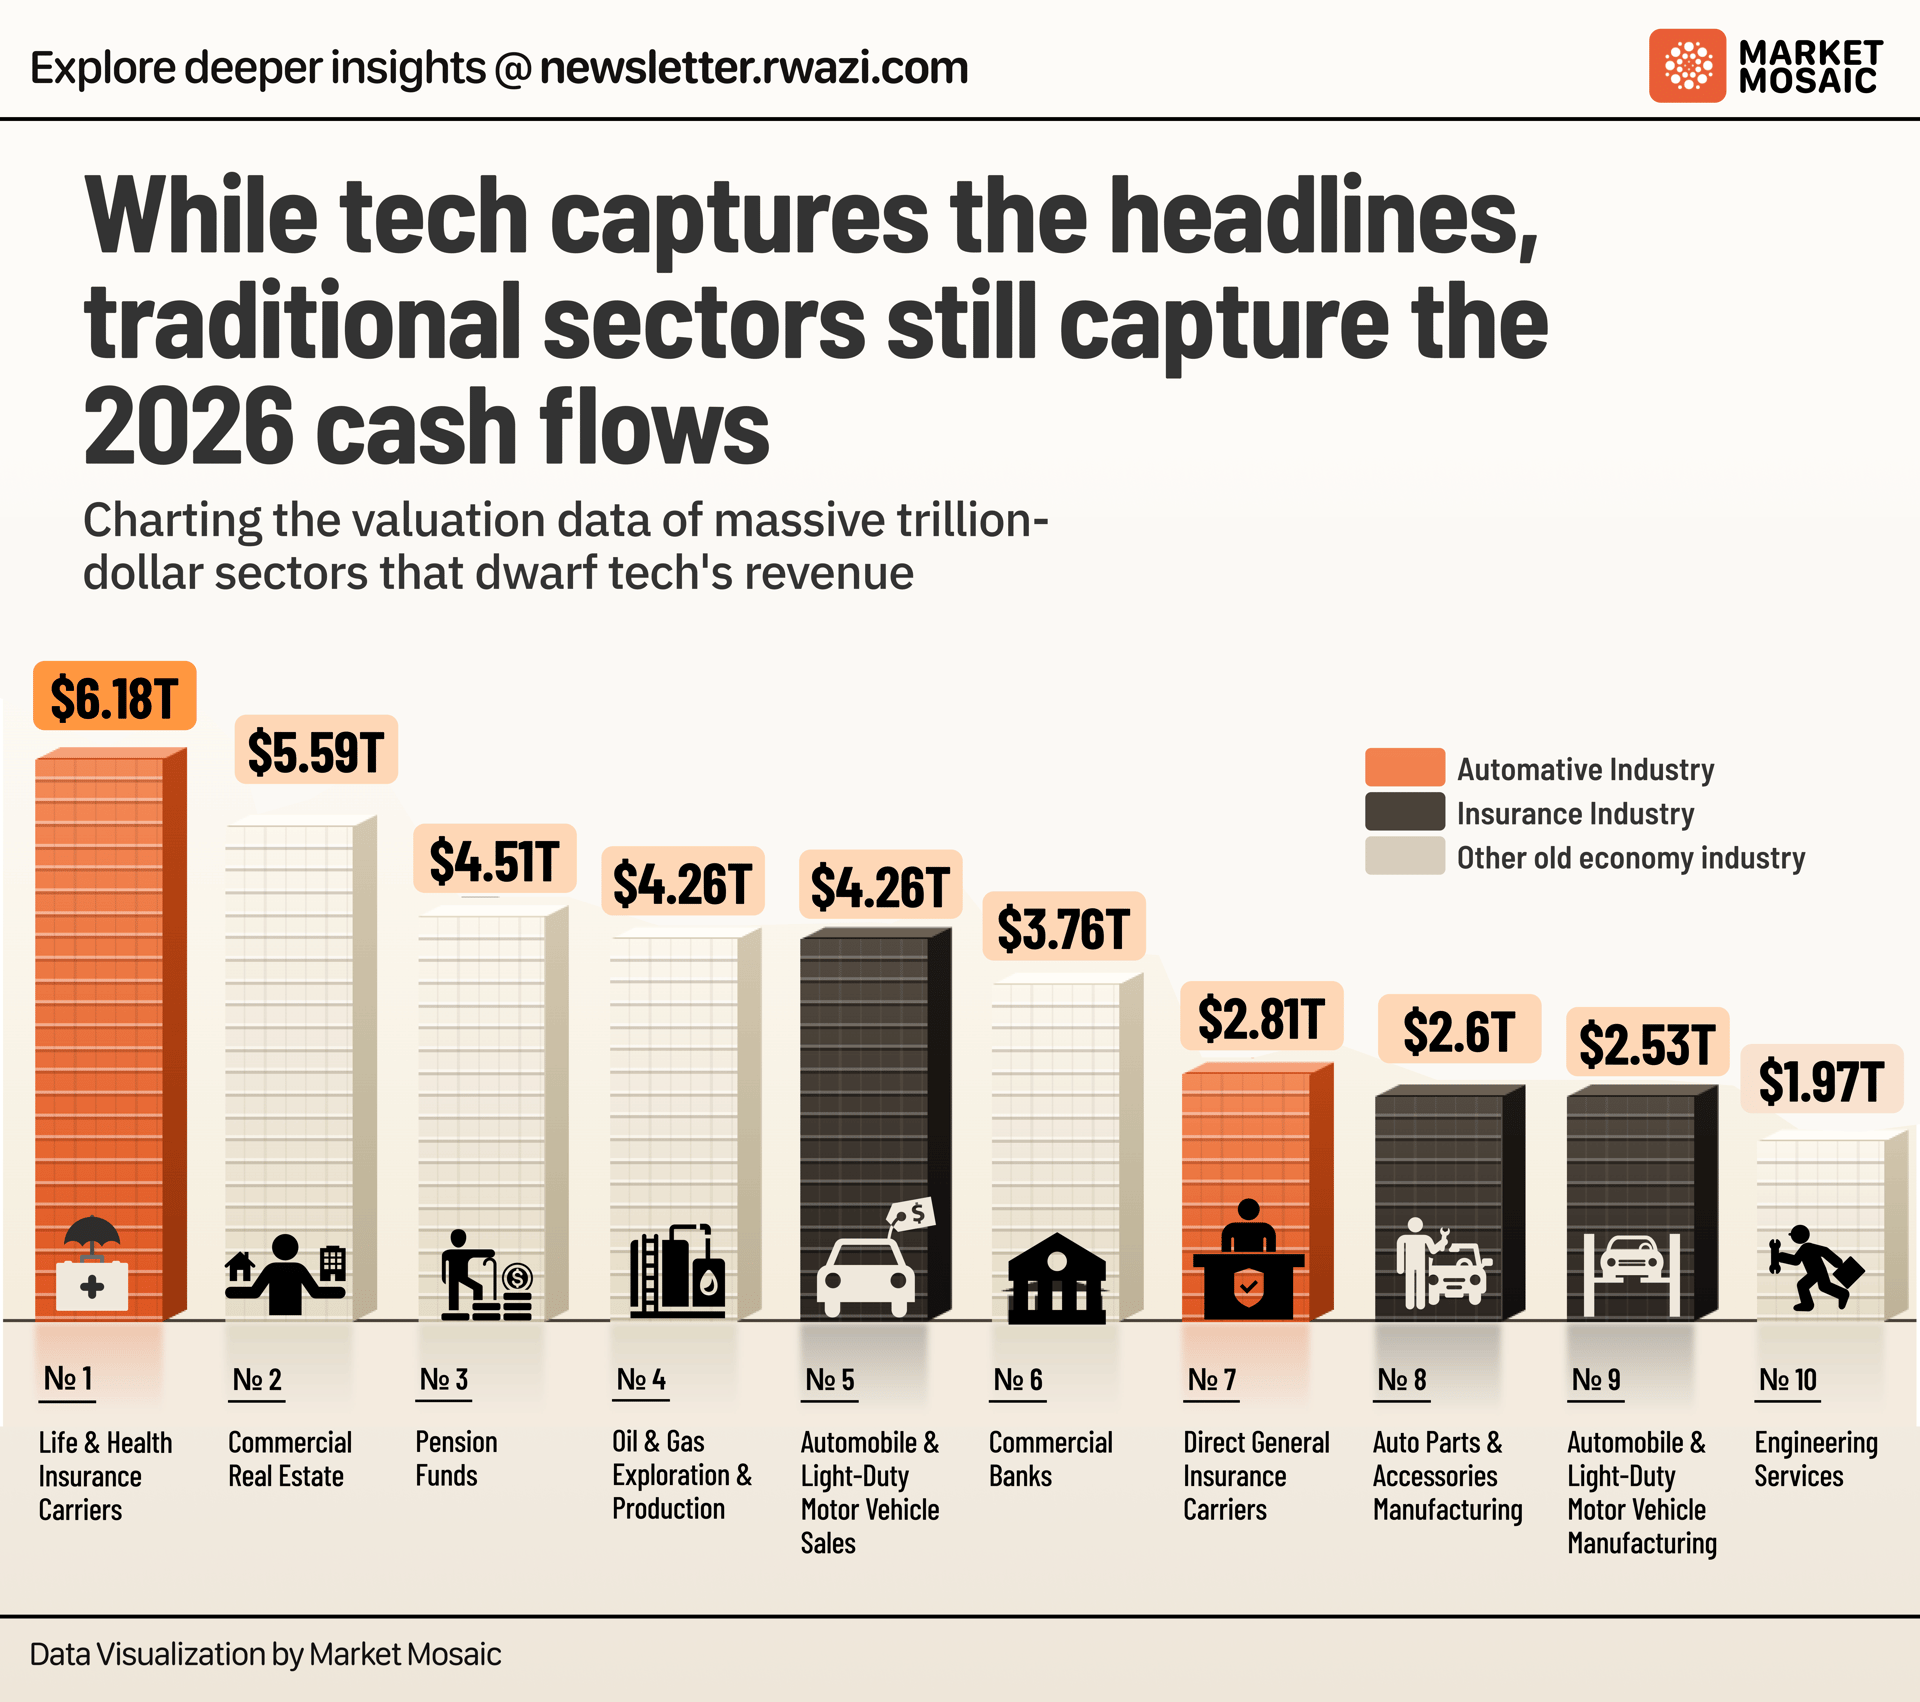
The world's biggest industry made $6.18 trillion
Public attention gravitates toward AI labs and social platforms. Revenue tells a different story. 2026 rankings place Life & Health Insurance at the top of the global economy, generating an estimated $6.18 trillion annually, more than double what most people would guess if asked to name the world's…
 ChartEdition #123
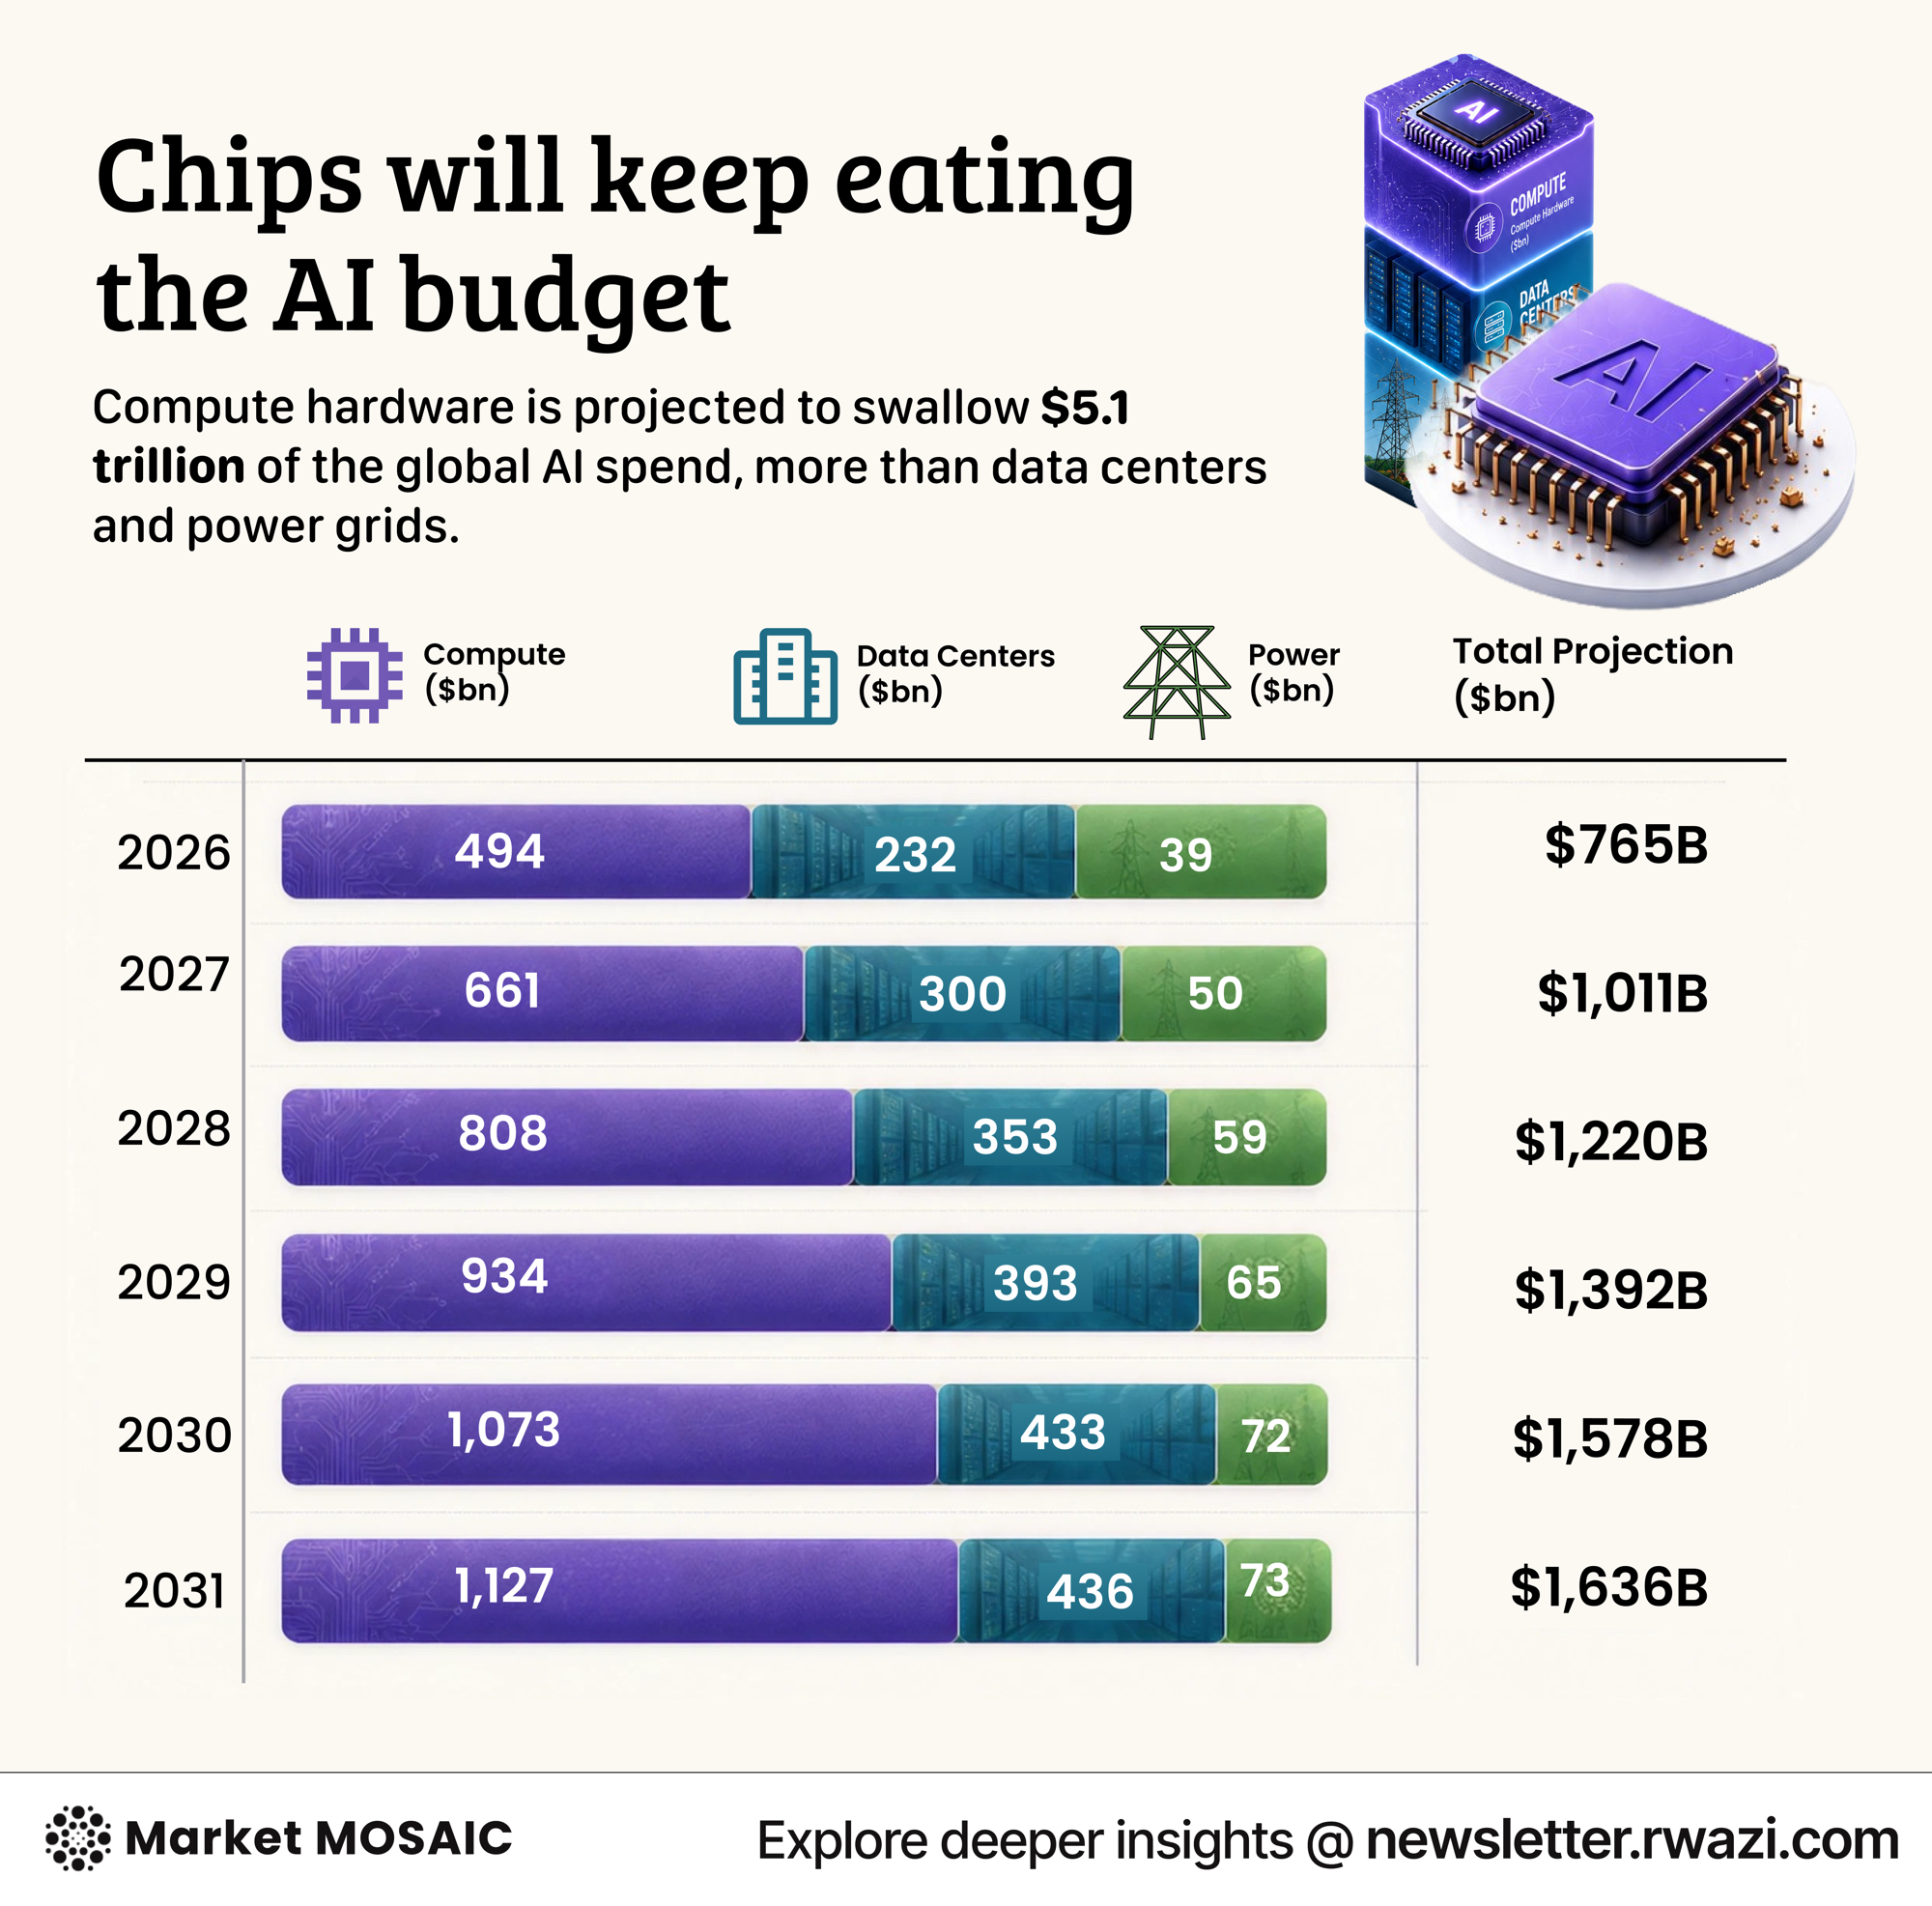
$7.6 trillion is being bet on AI infrastructure.
A new market projection puts global AI capital expenditure at $7.6 trillion between 2026 and 2031, covering compute, data centers, and power. Compute, mostly GPUs, takes the largest share at roughly $5.1 trillion, rising from $494 billion this year to $1.13 trillion by 2031. Buried in the model is…
 ChartEdition #122
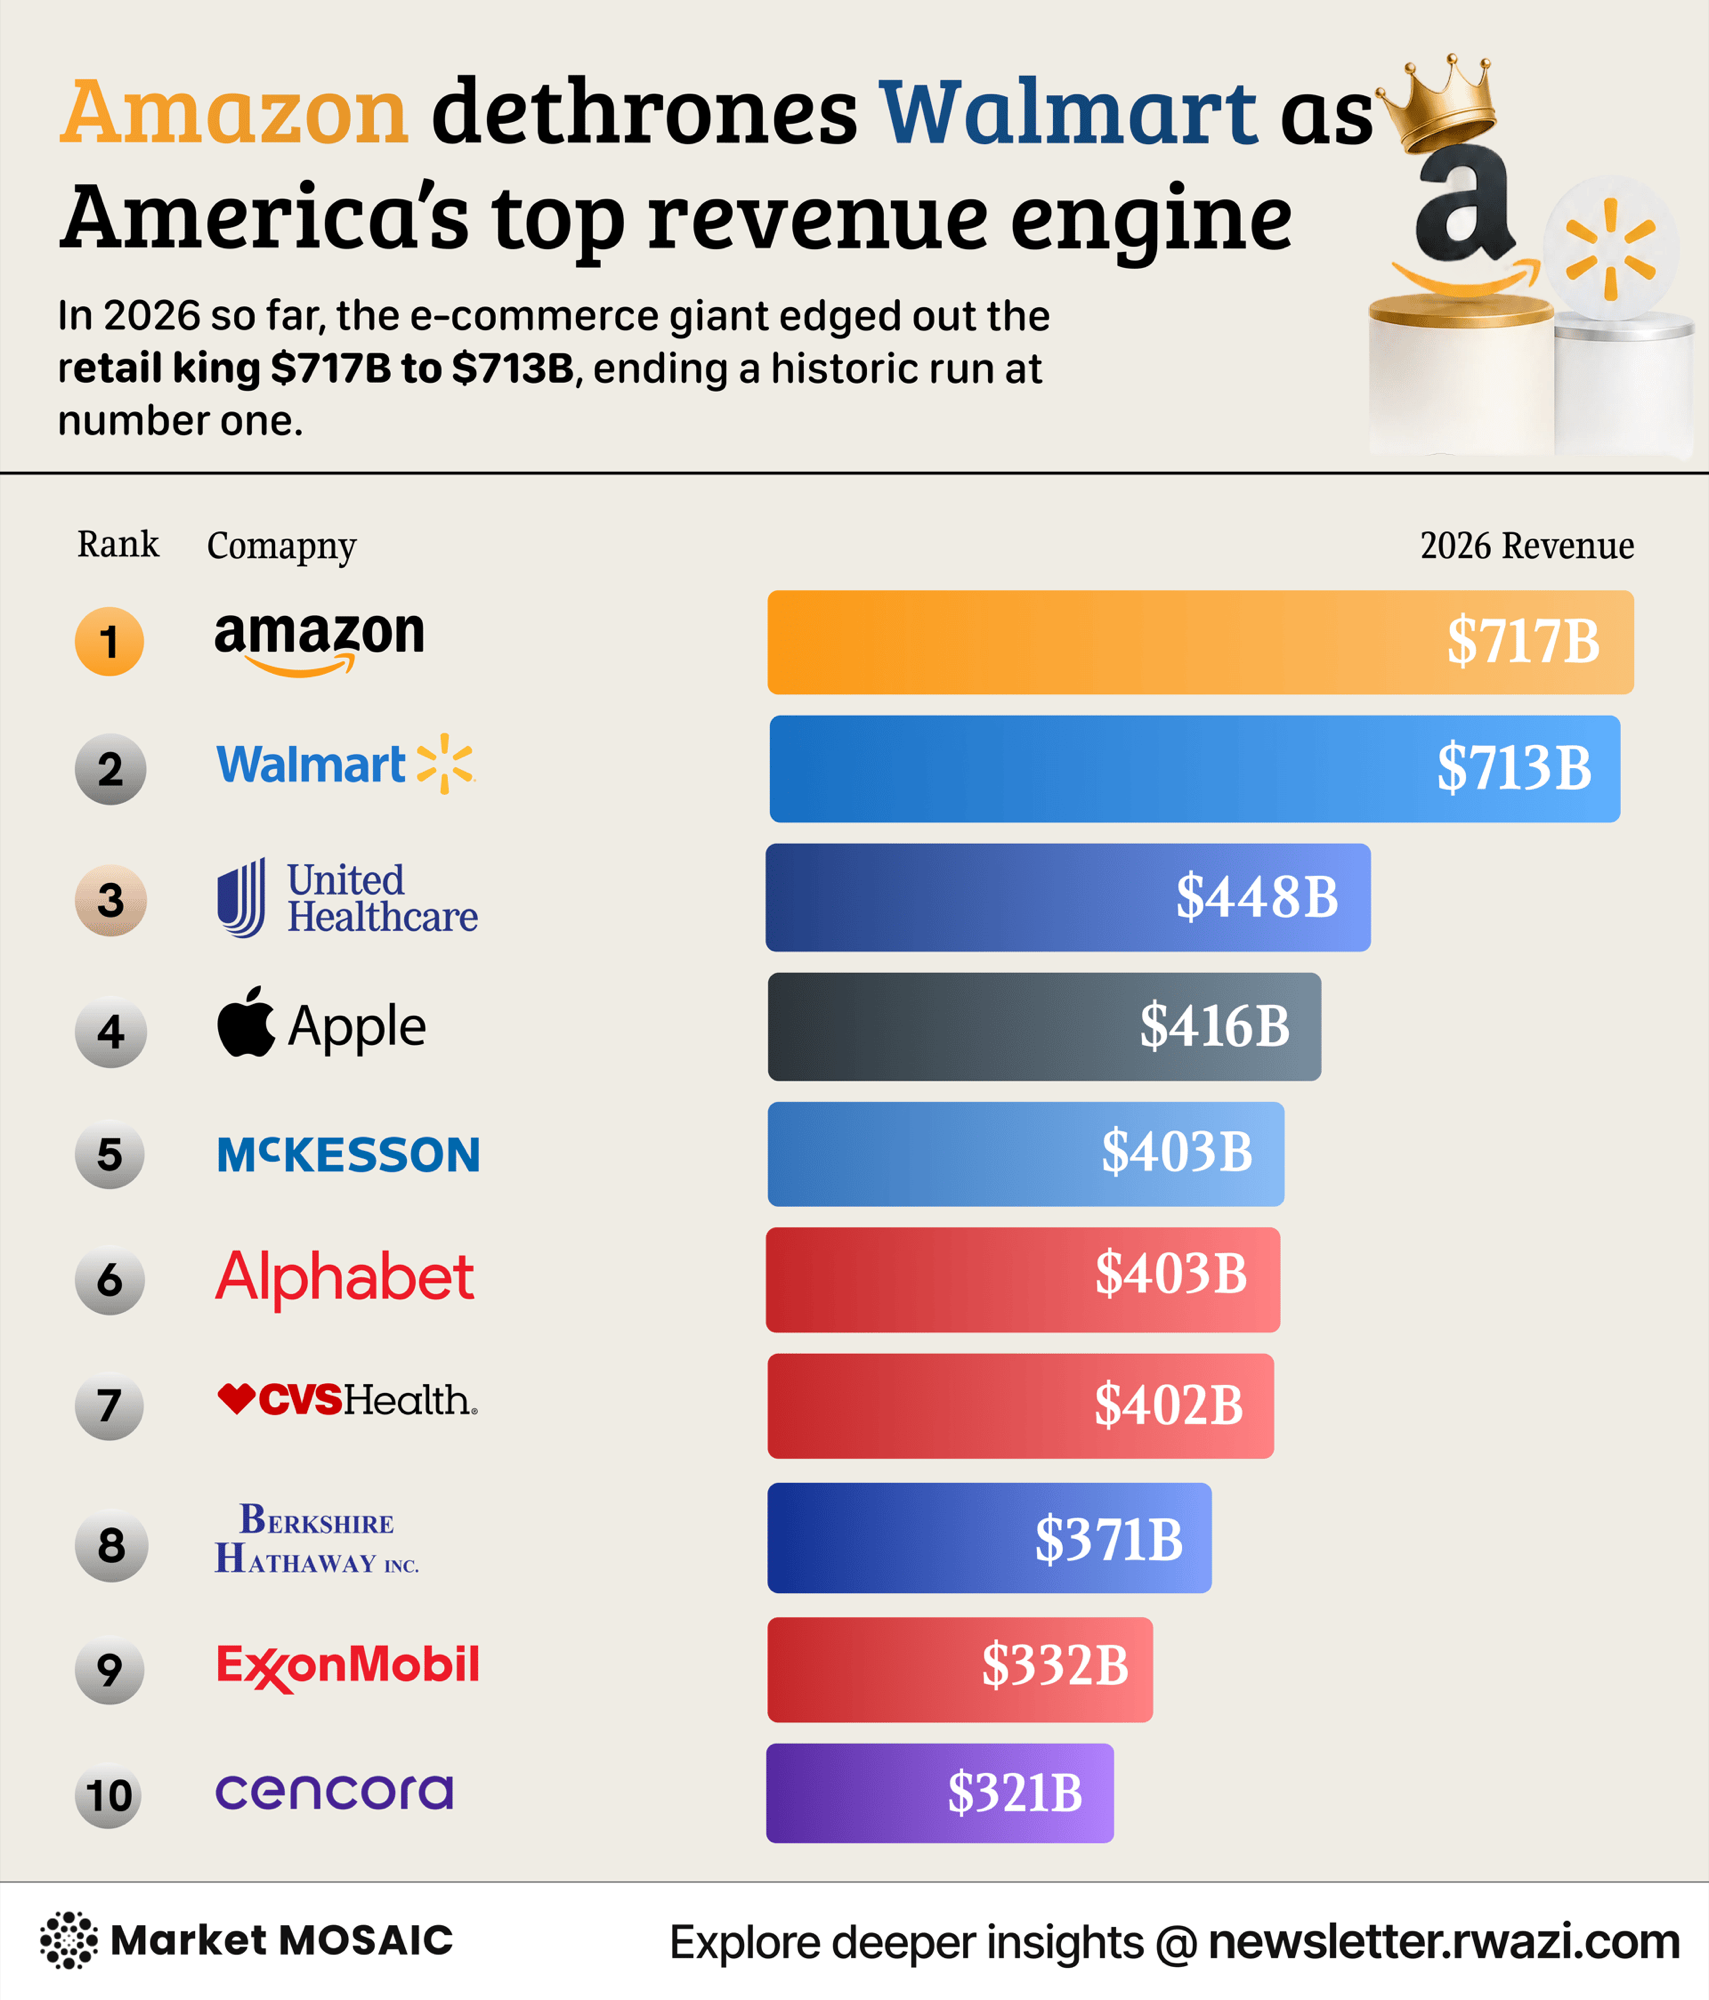
Amazon just took the top spot from Walmart
For the first time in more than a decade, Walmart is no longer America's biggest company by revenue. Amazon has claimed the top spot after generating $717 billion in fiscal 2025. Online stores stayed its largest segment, but the fastest growth came from advertising and Amazon Web Services, its…
 ChartEdition #103
Global inflation to hit 3.7% in 2026 as U.S. stabilises at 2.4%
After years of volatility, the global economy is finding its footing. Global inflation is projected to ease from 4.2% in 2025 to 3.7% in 2026 . However, the global map remains deeply fractured. While major economies like China (0.7%), Switzerland (0.6%), and Italy (2%) are effectively seeing price…
 ChartEdition #94
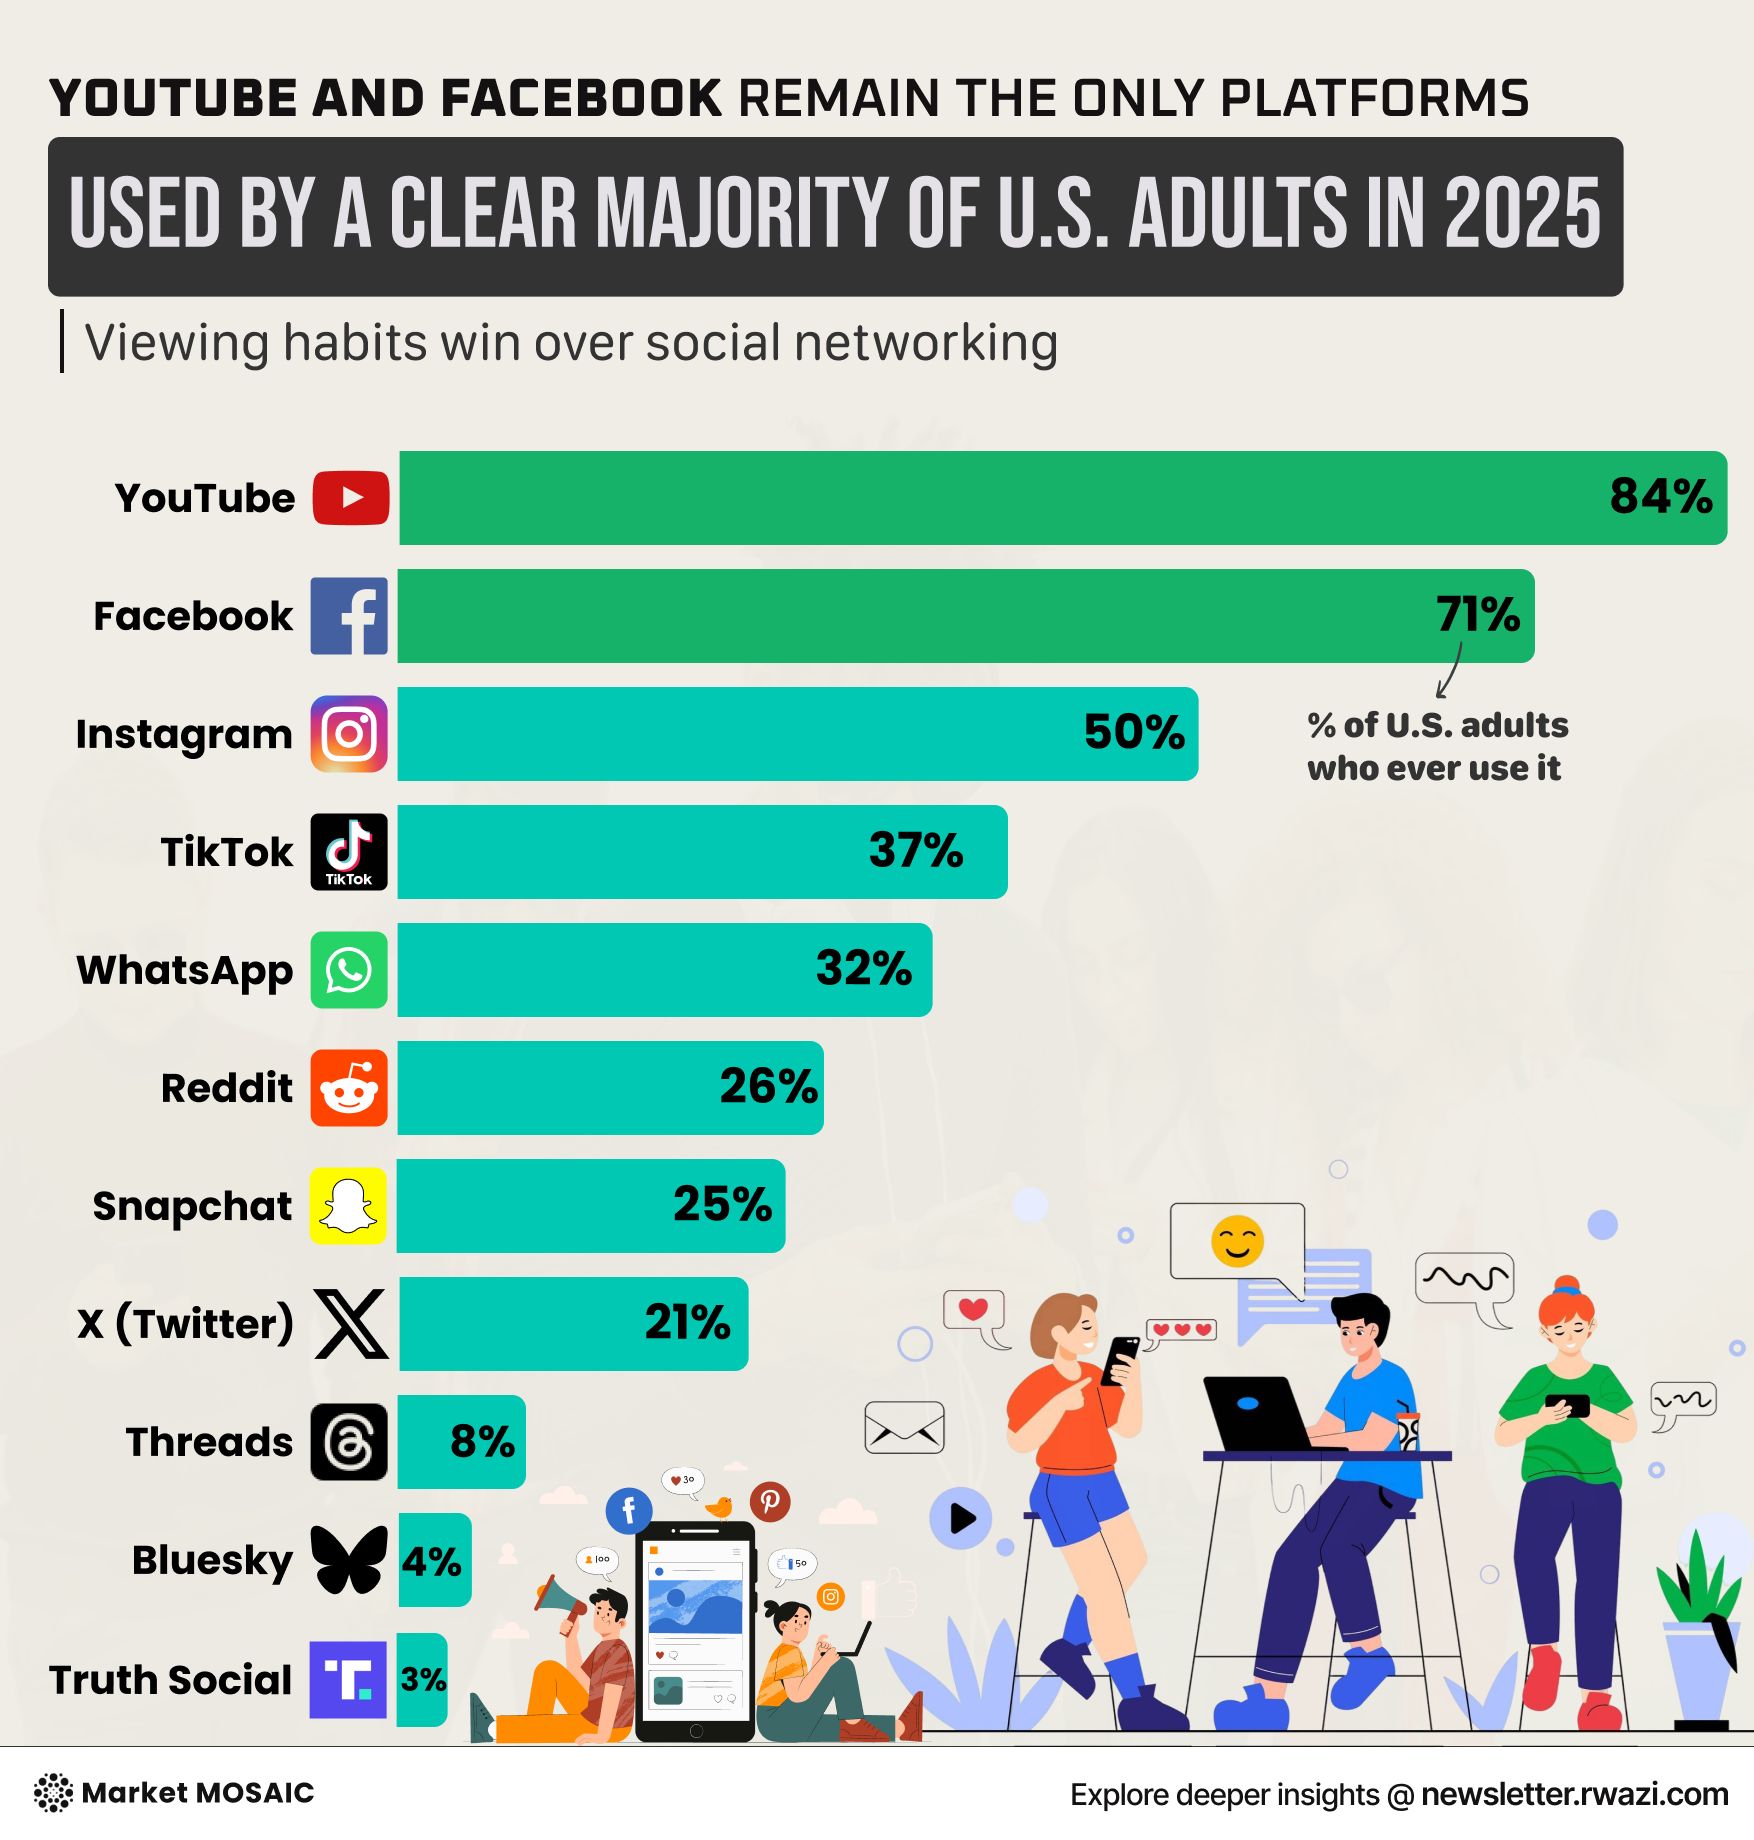
The old guard still maintains its grip on digital consumer attention
The latest social media usage data shows that established platforms continue to command overwhelming consumer attention. YouTube reaches 84% of US adults, while Facebook captures 71%. Instagram has climbed to 5% adoption, and TikTok sits at 37%. Newer platforms face steep challenges. X reaches 21%…
 ChartEdition #94
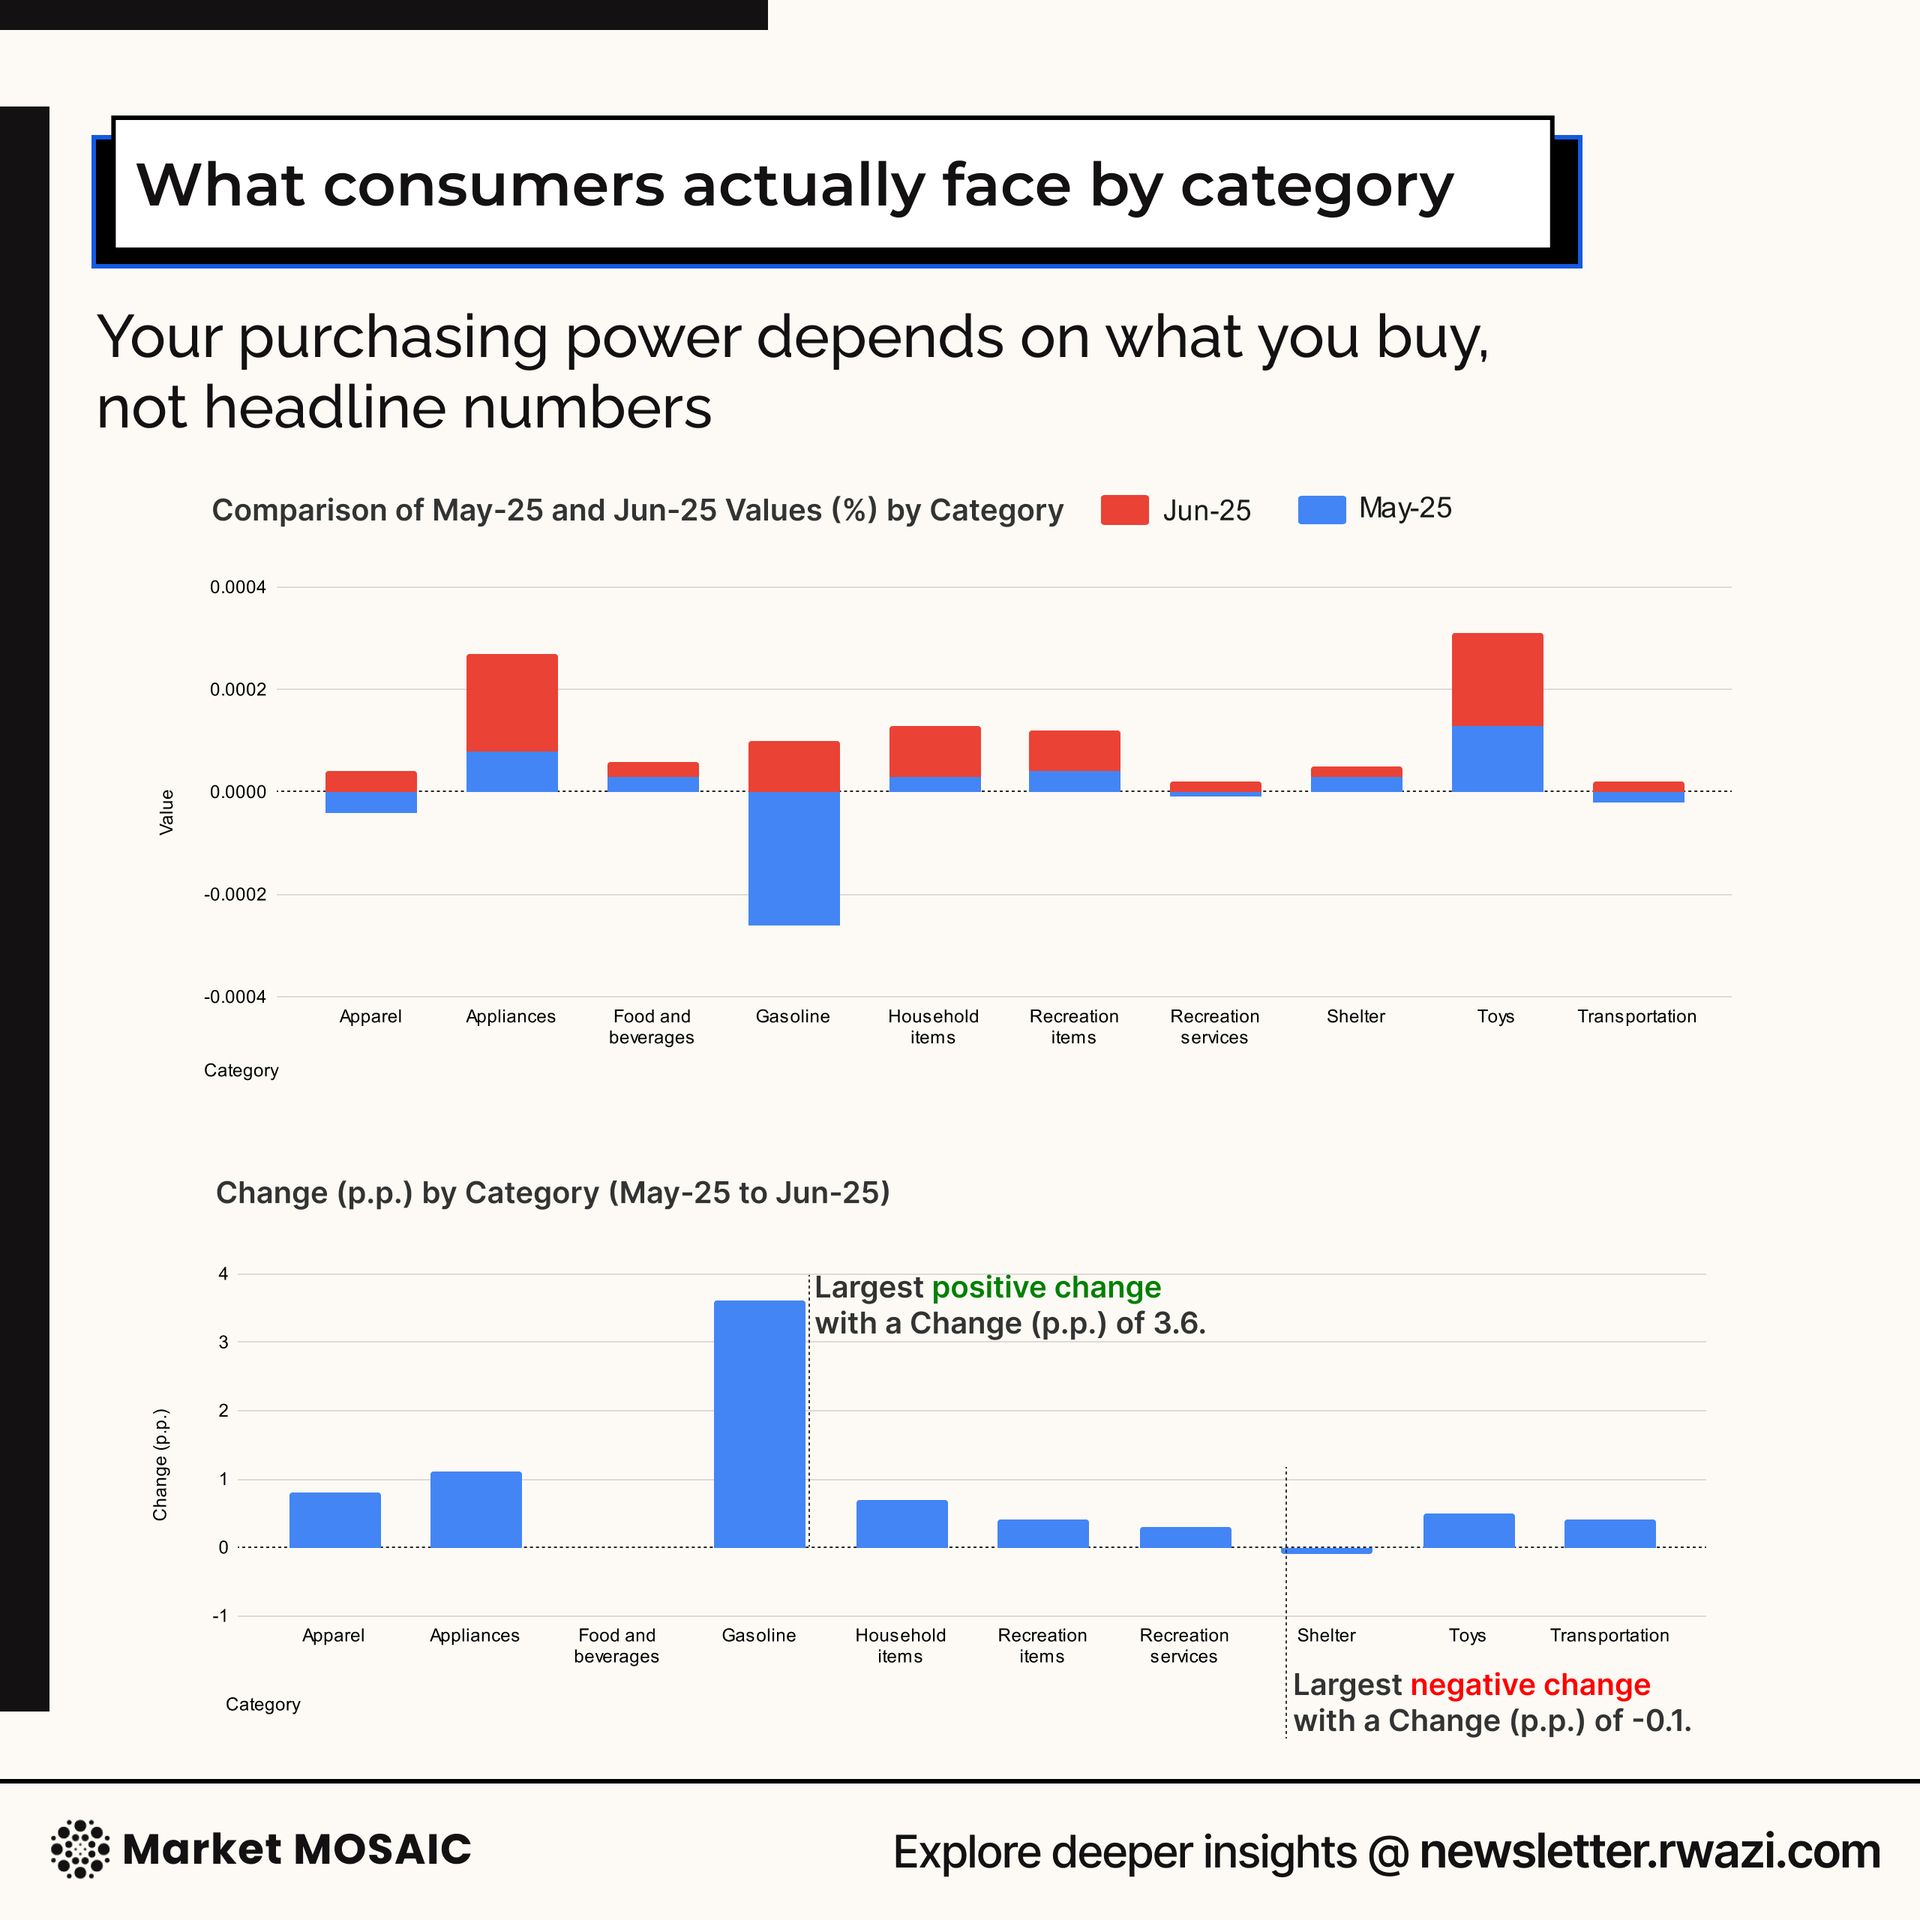
Scale and diversification command premium valuations
Procter & Gamble leads the consumer packaged goods sector with a market capitalisation of $374.5 billion, far ahead of competitors. This valuation reflects investor preference for diversified portfolios spanning beauty, home care, health, and personal care. Coca-Cola follows at $292.5 billion,…
 ChartEdition #93
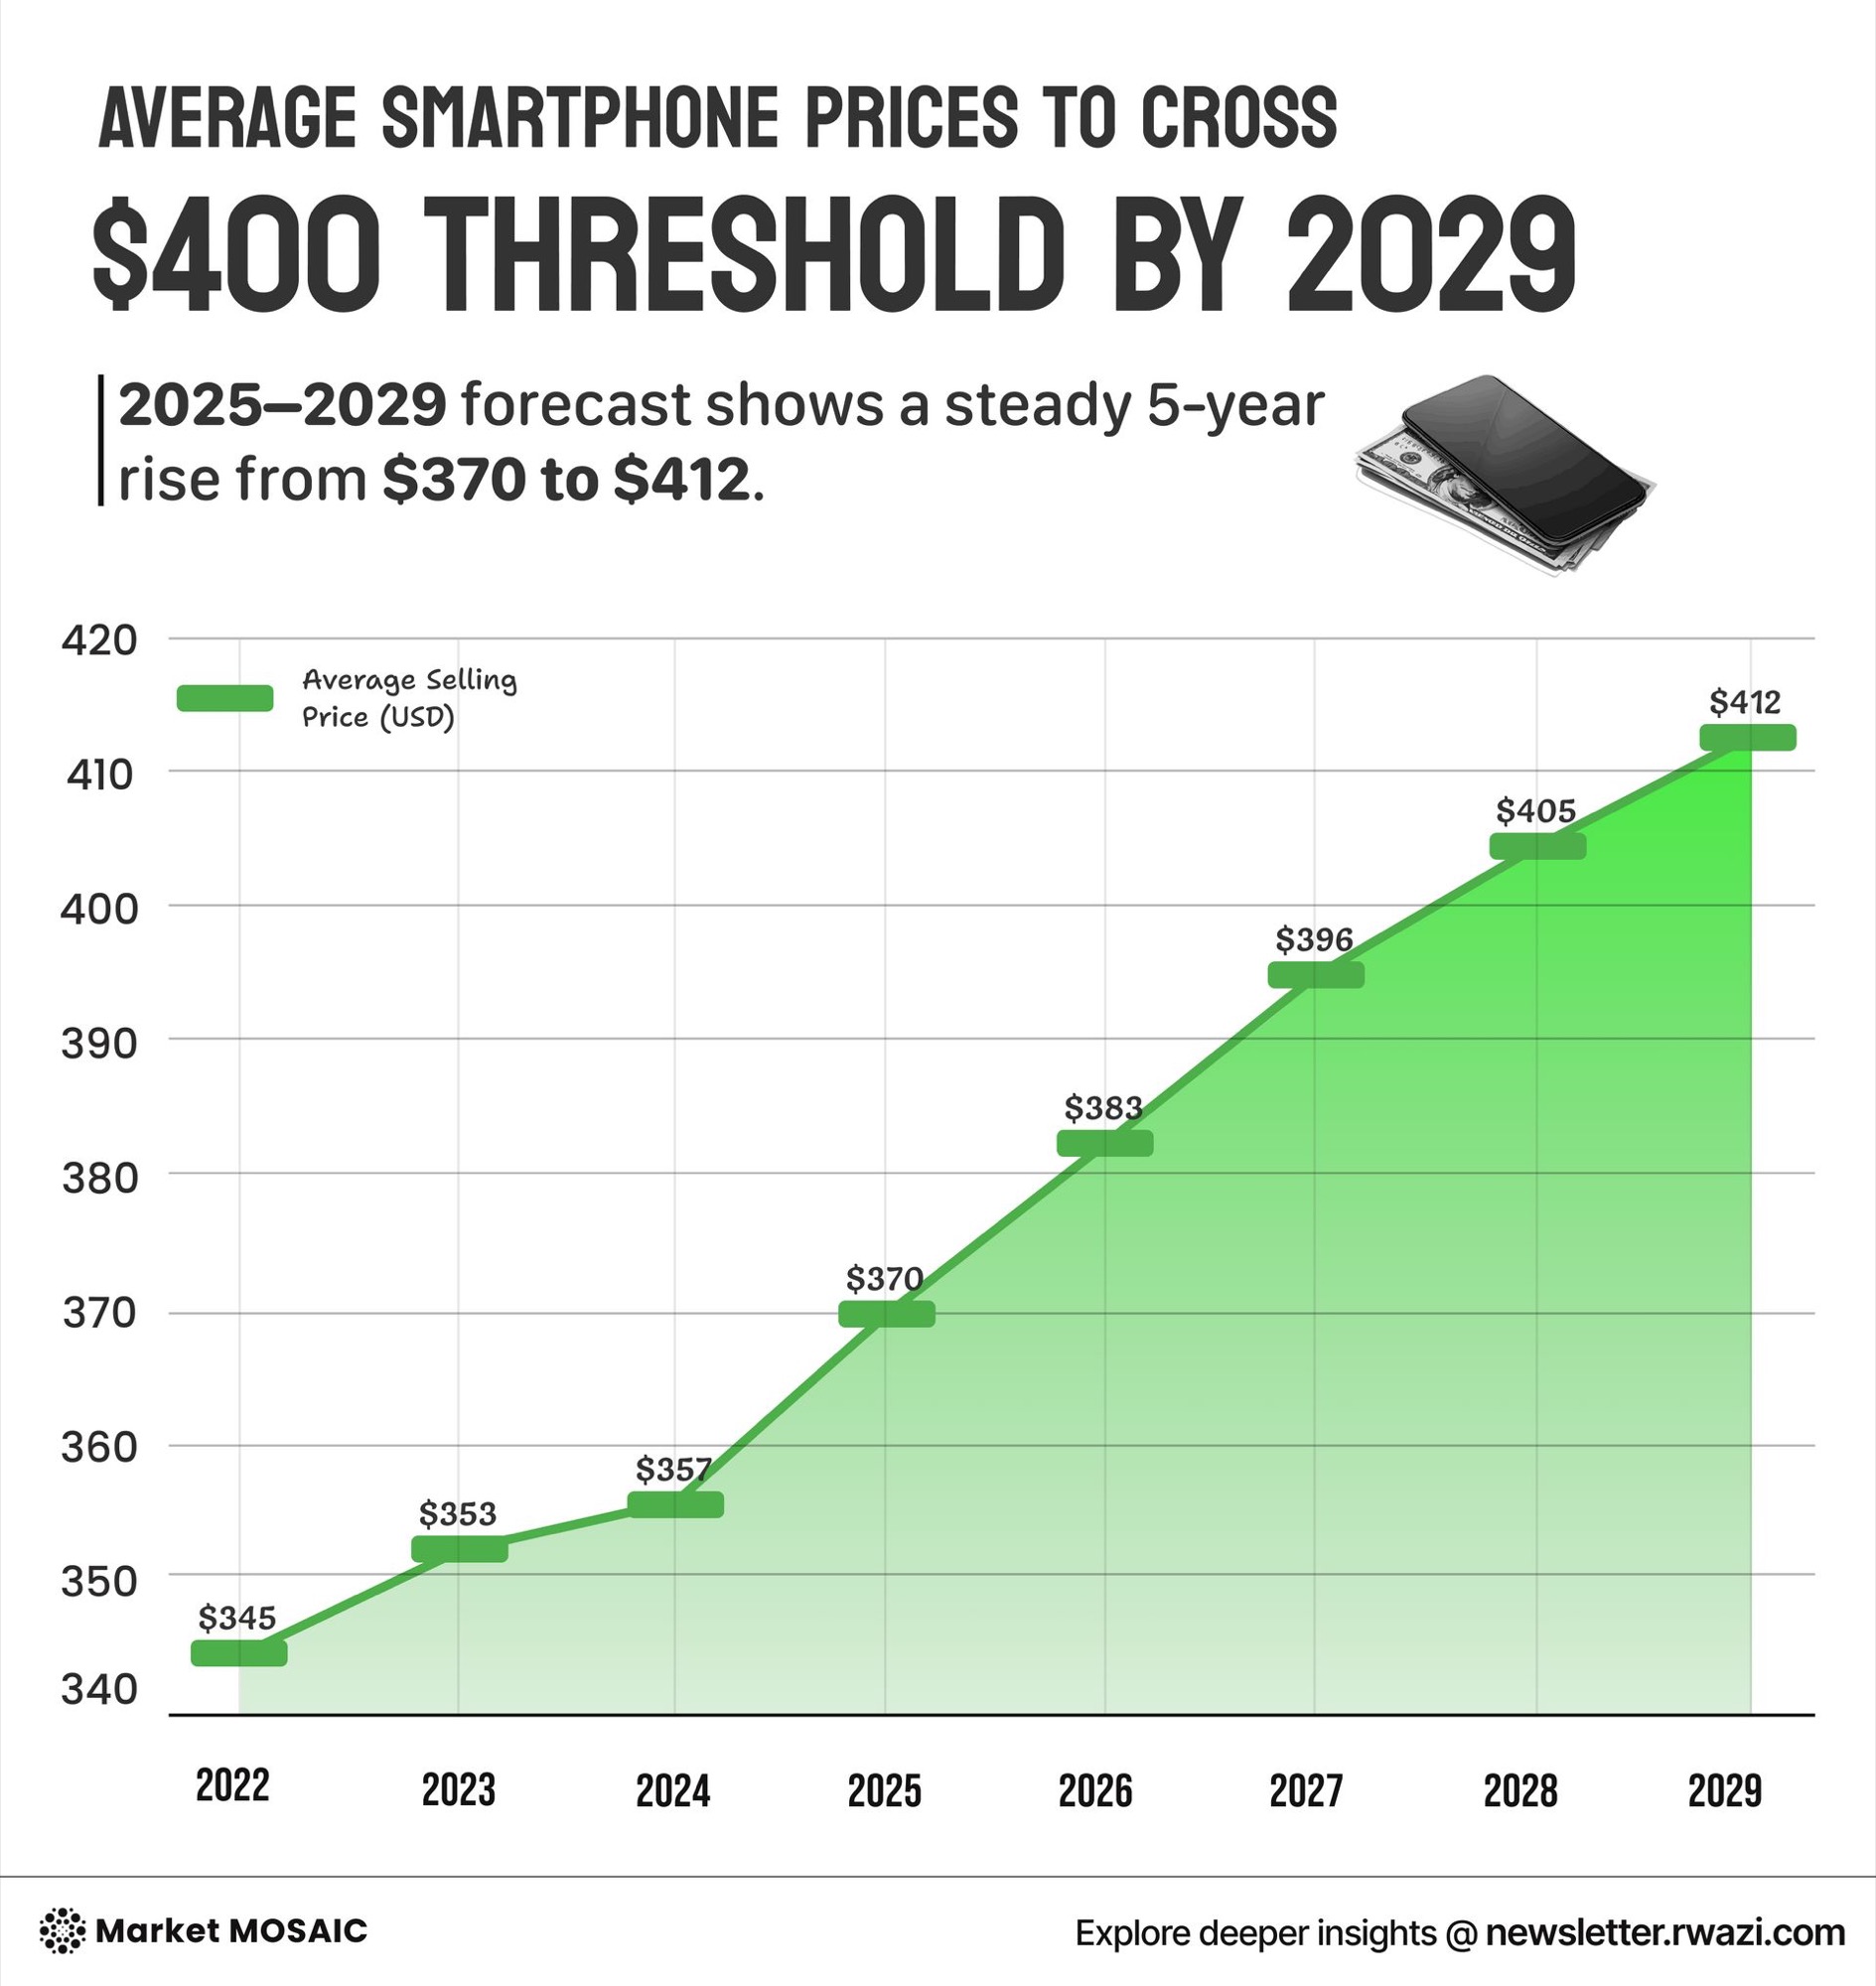
The premium smartphone era arrives as the industry matures
Do you know that the average smartphone prices are rising from 370 dollars this year to 412 dollars by 2029? Even with a revenue growth outpacing unit sales at 5% annually. North America leads with prices approaching 984 dollars by 2026, driven by AI features and foldable devices. China shows…
 ChartEdition #92
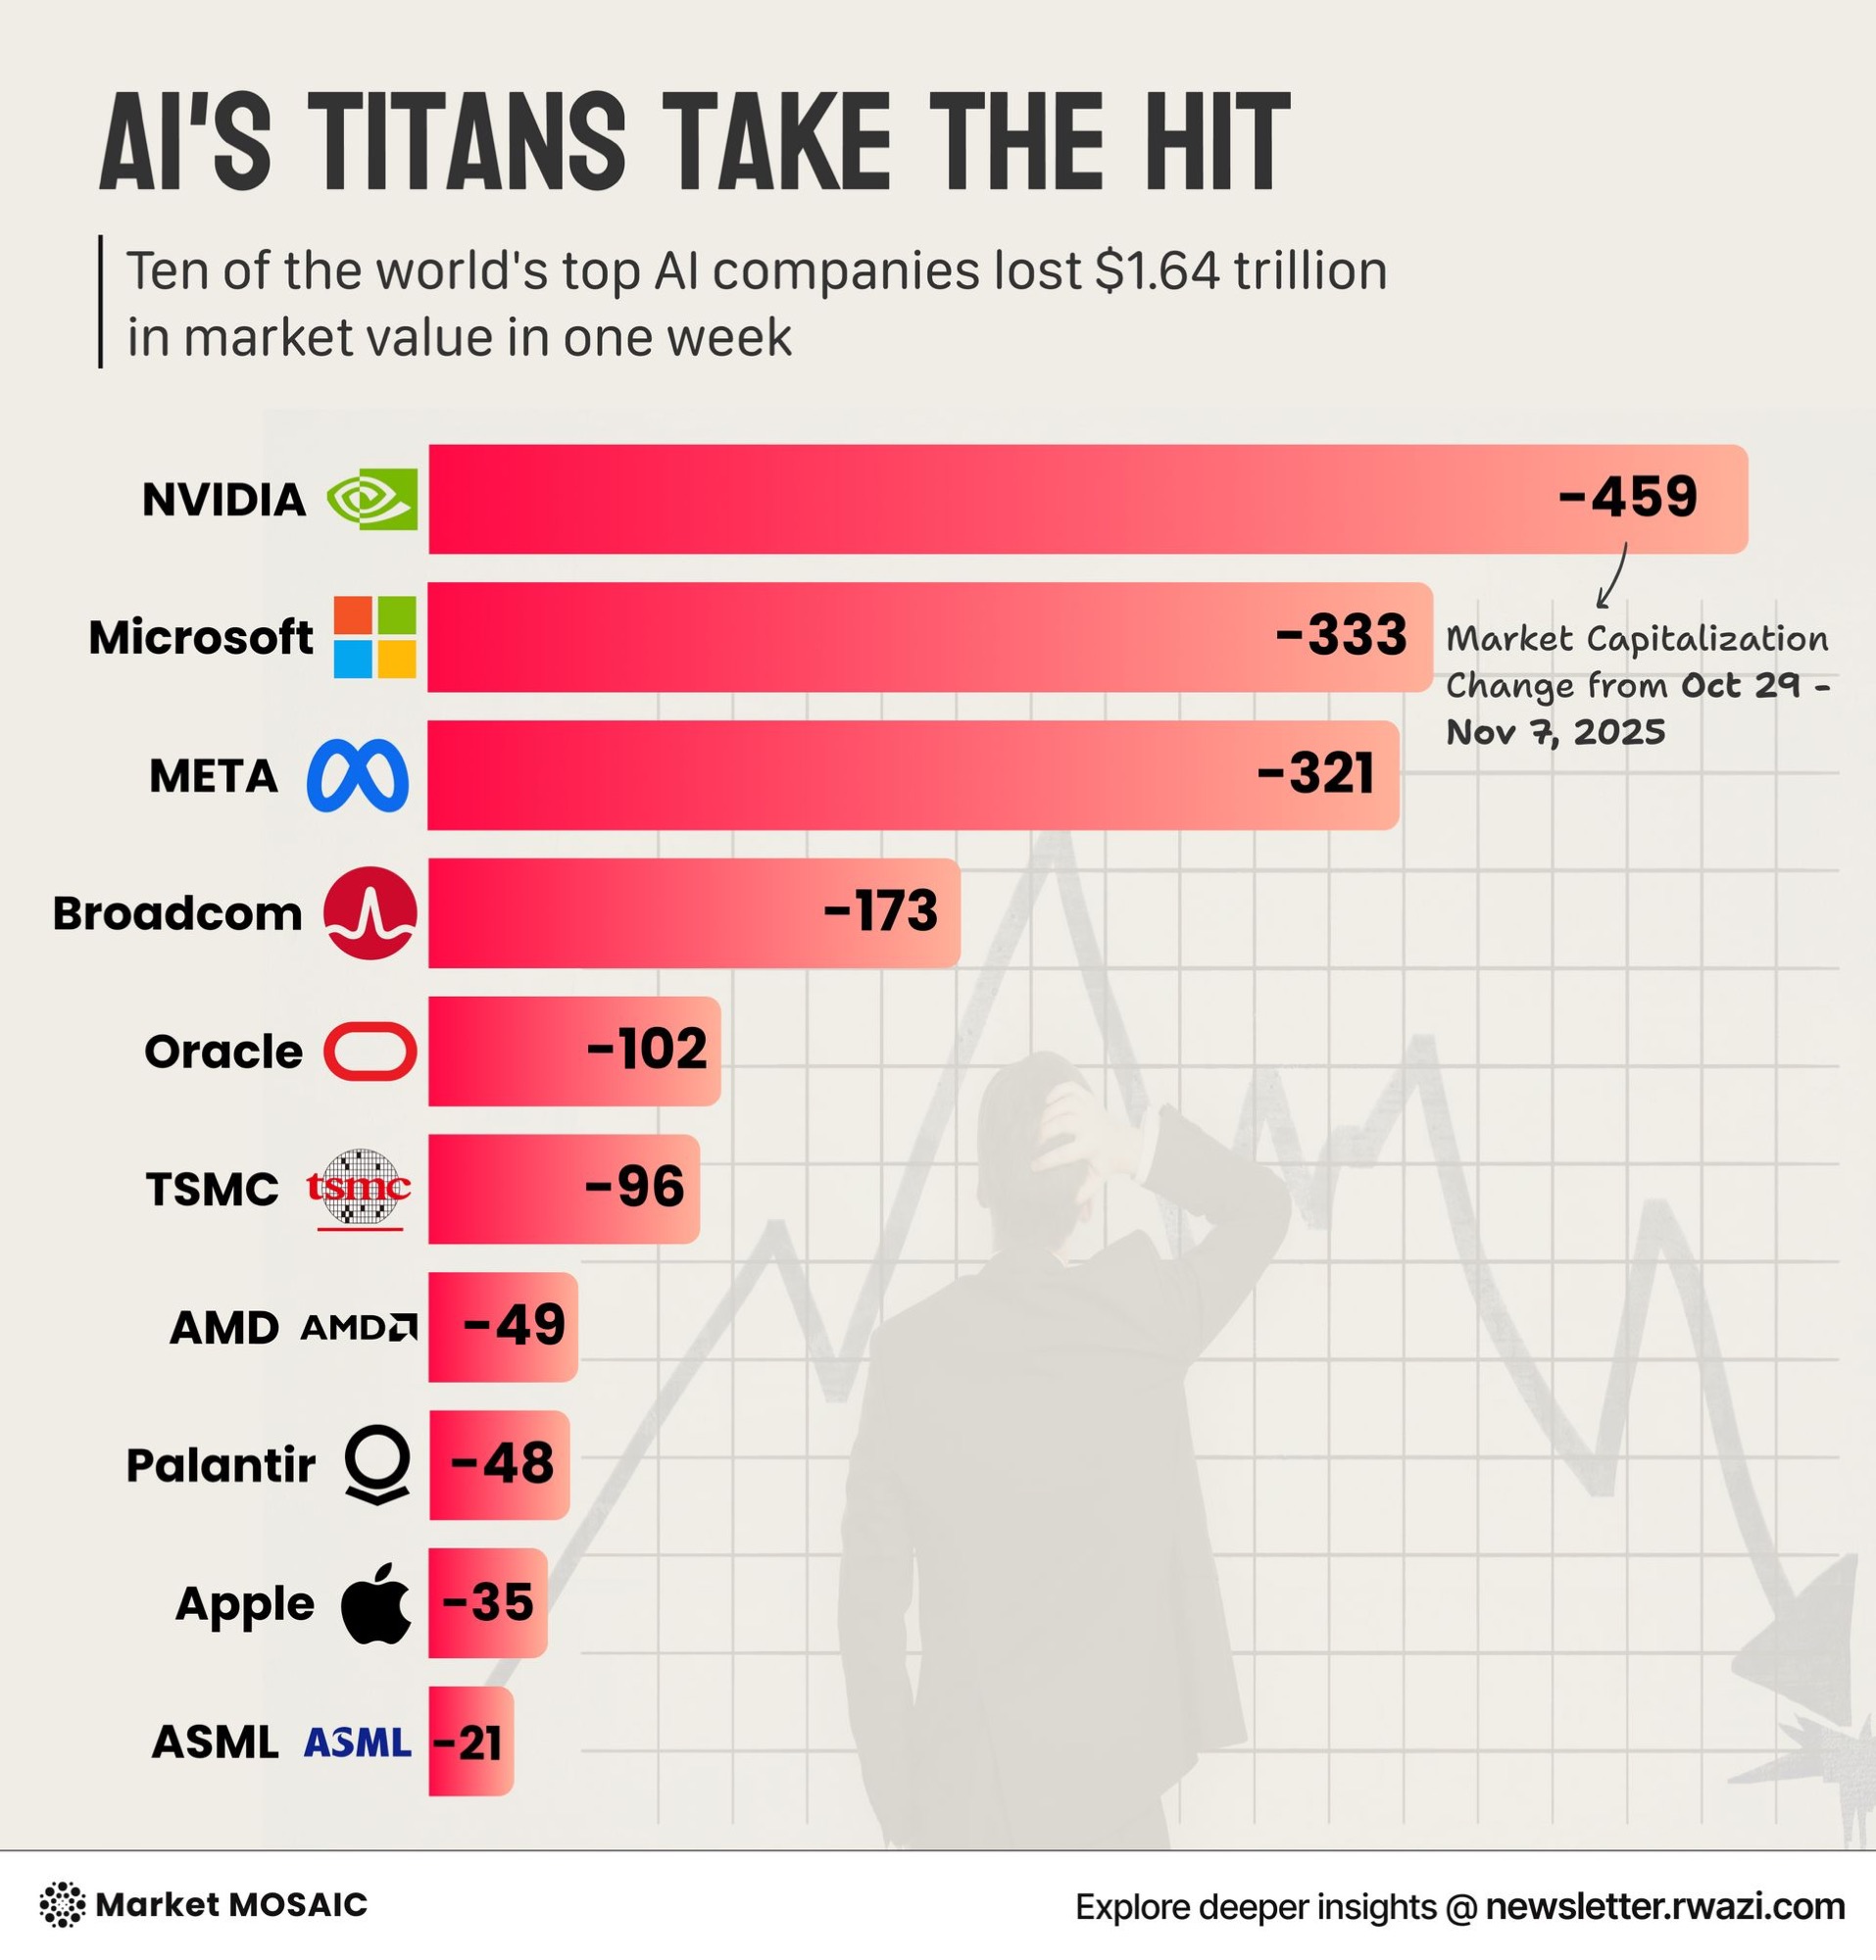
The great AI market cap collaspe
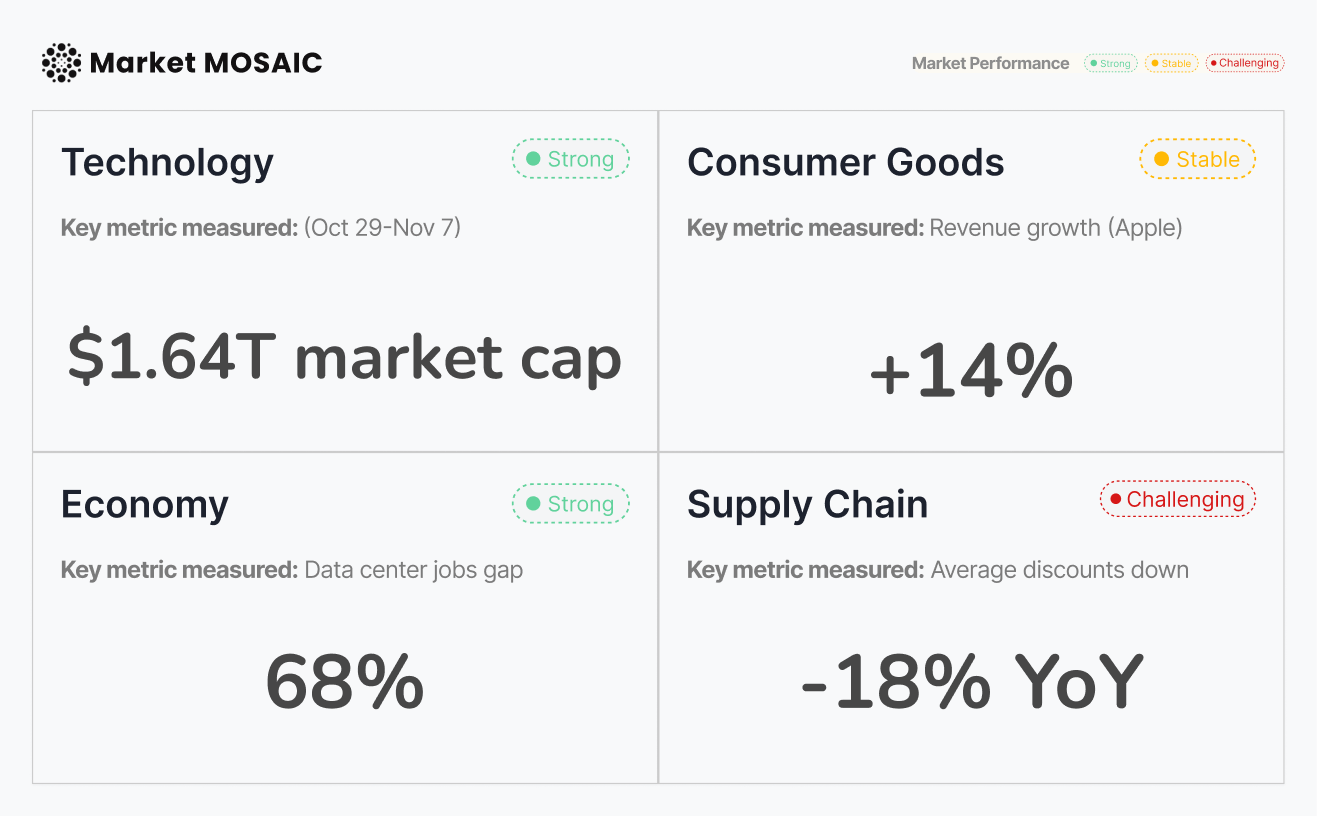
Ten major AI companies collectively lost $1.64 trillion in market capitalisation between October 29 and November 7, 2025. This is the biggest market correction in the AI sector's brief but explosive history, with Nvidia alone shedding $459 billion in value, followed by Microsoft at $333 billion and…
 Sector trackerEdition #92
Sector Performance Tracker
Ten major AI companies collectively lost $1.64 trillion in market capitalisation between October 29 and November 7, 2025. This is the biggest market correction in the AI sector's brief but explosive history, with Nvidia alone shedding $459 billion in value, followed by Microsoft at $333 billion and…
 ChartEdition #91
Northern Virginia dominates cloud infrastructure in the US
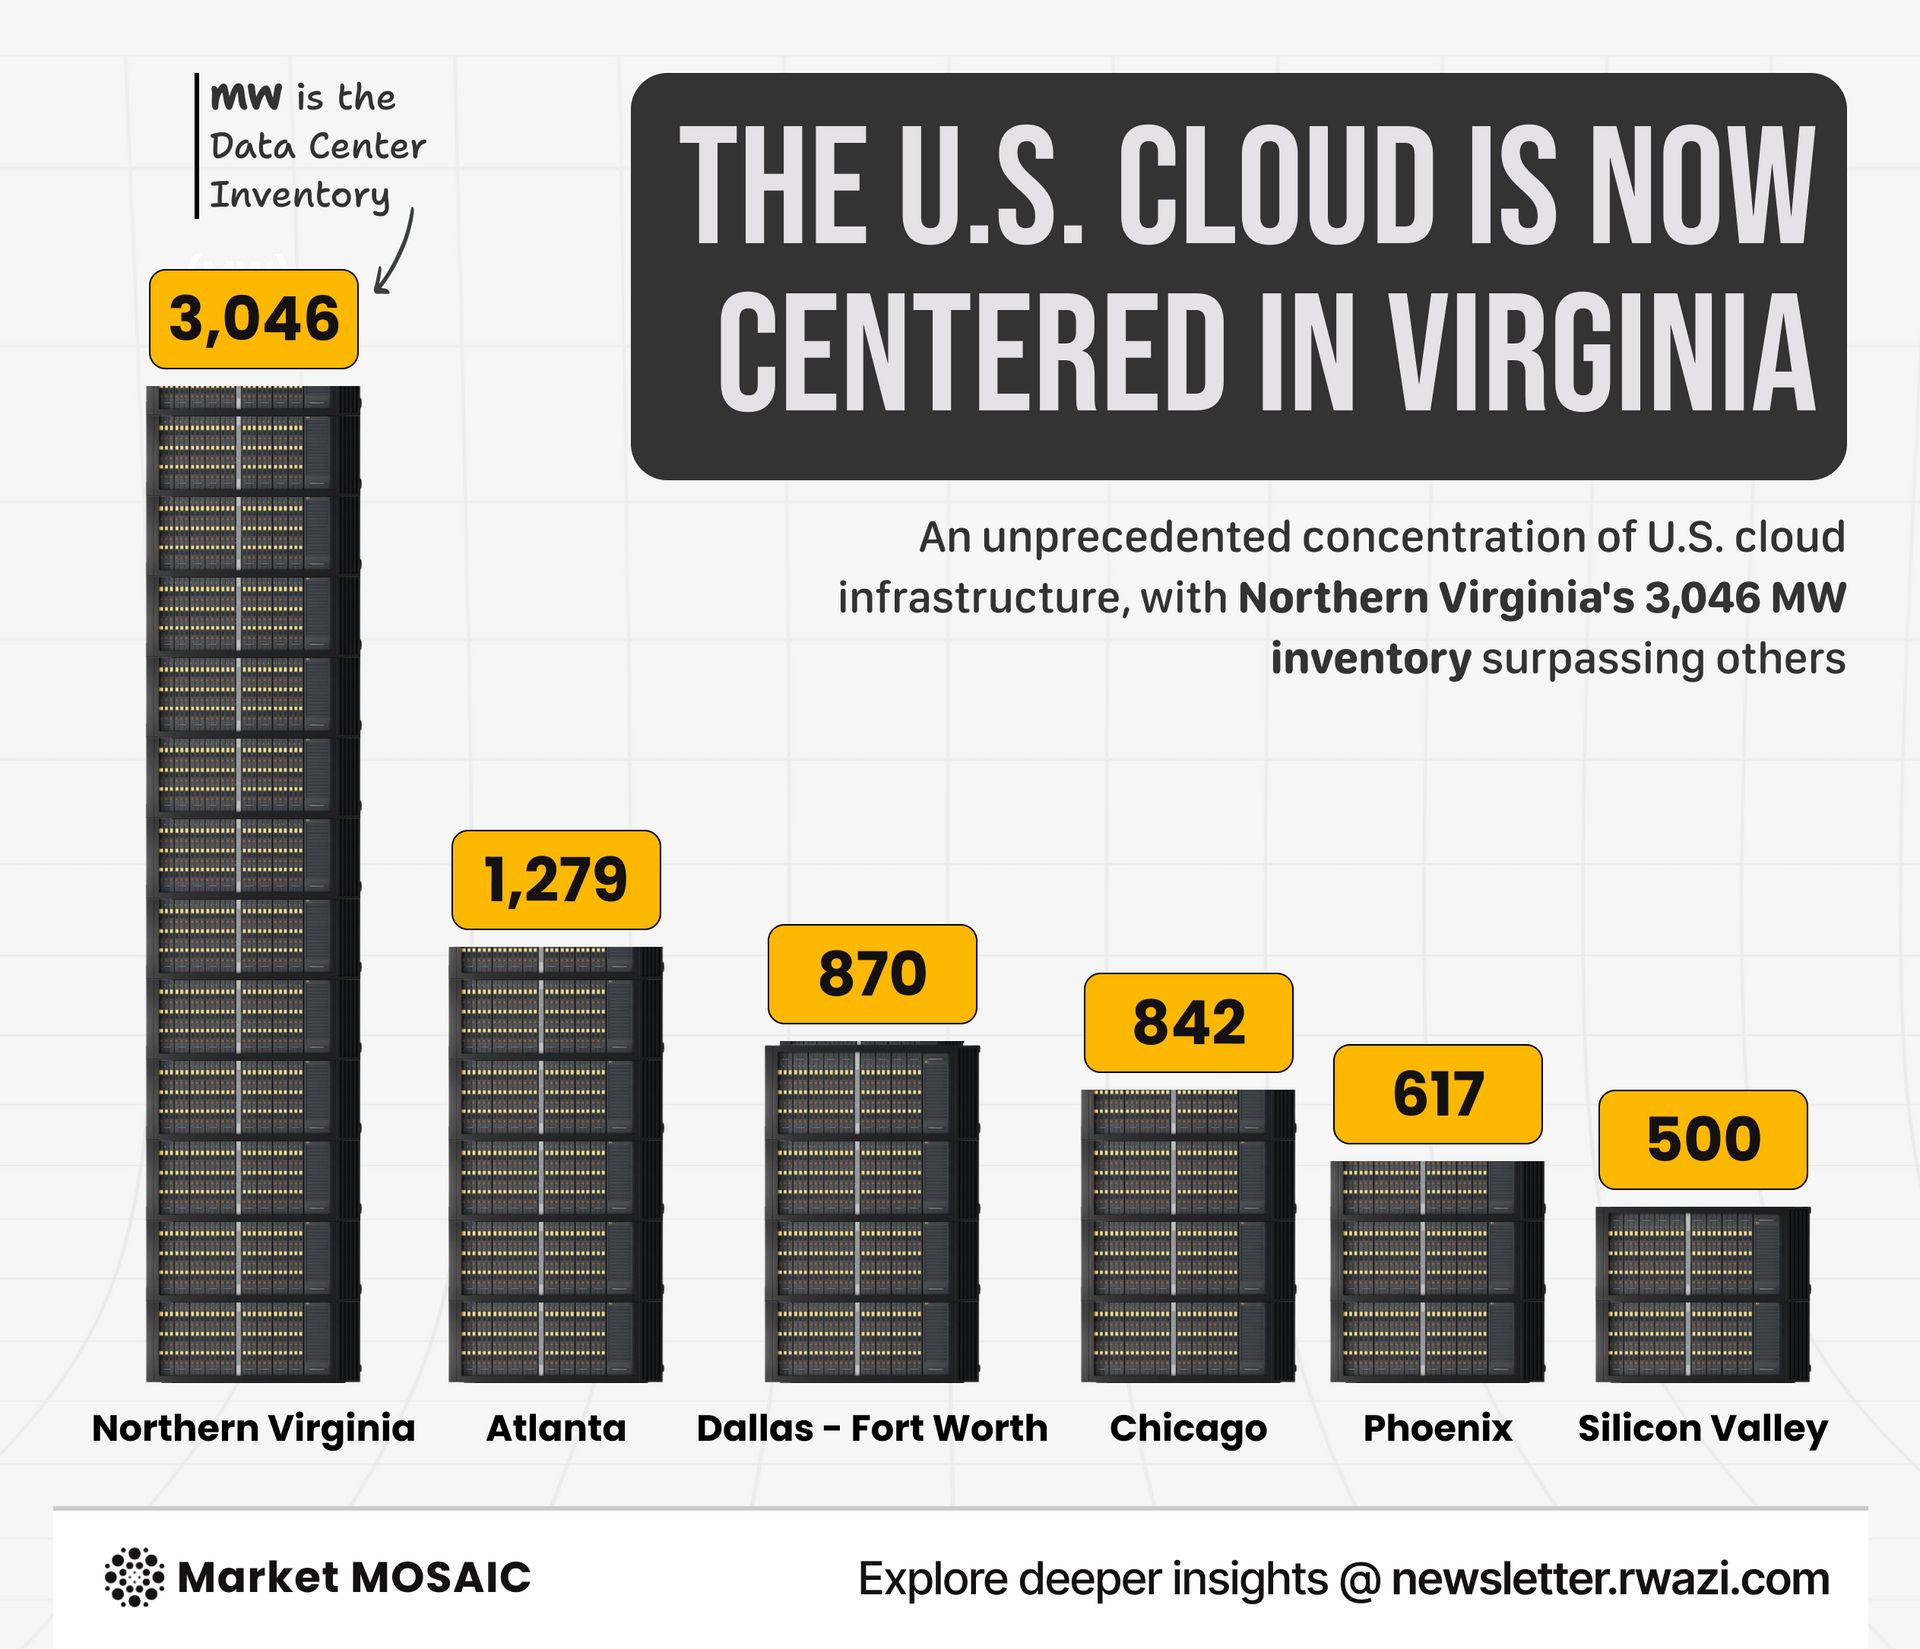
Northern Virginia leads U.S. cloud infrastructure with 3,046 MW of data centre capacity, more than double Atlanta's 1,279 MW. Dallas-Fort Worth follows at 870 MW, Chicago at 842 MW, Phoenix at 617 MW, and Silicon Valley at 500 MW. This concentration powers the seamless digital experiences consumers…
 ChartEdition #90
Economic growth forecast dims in the light of trade tensions
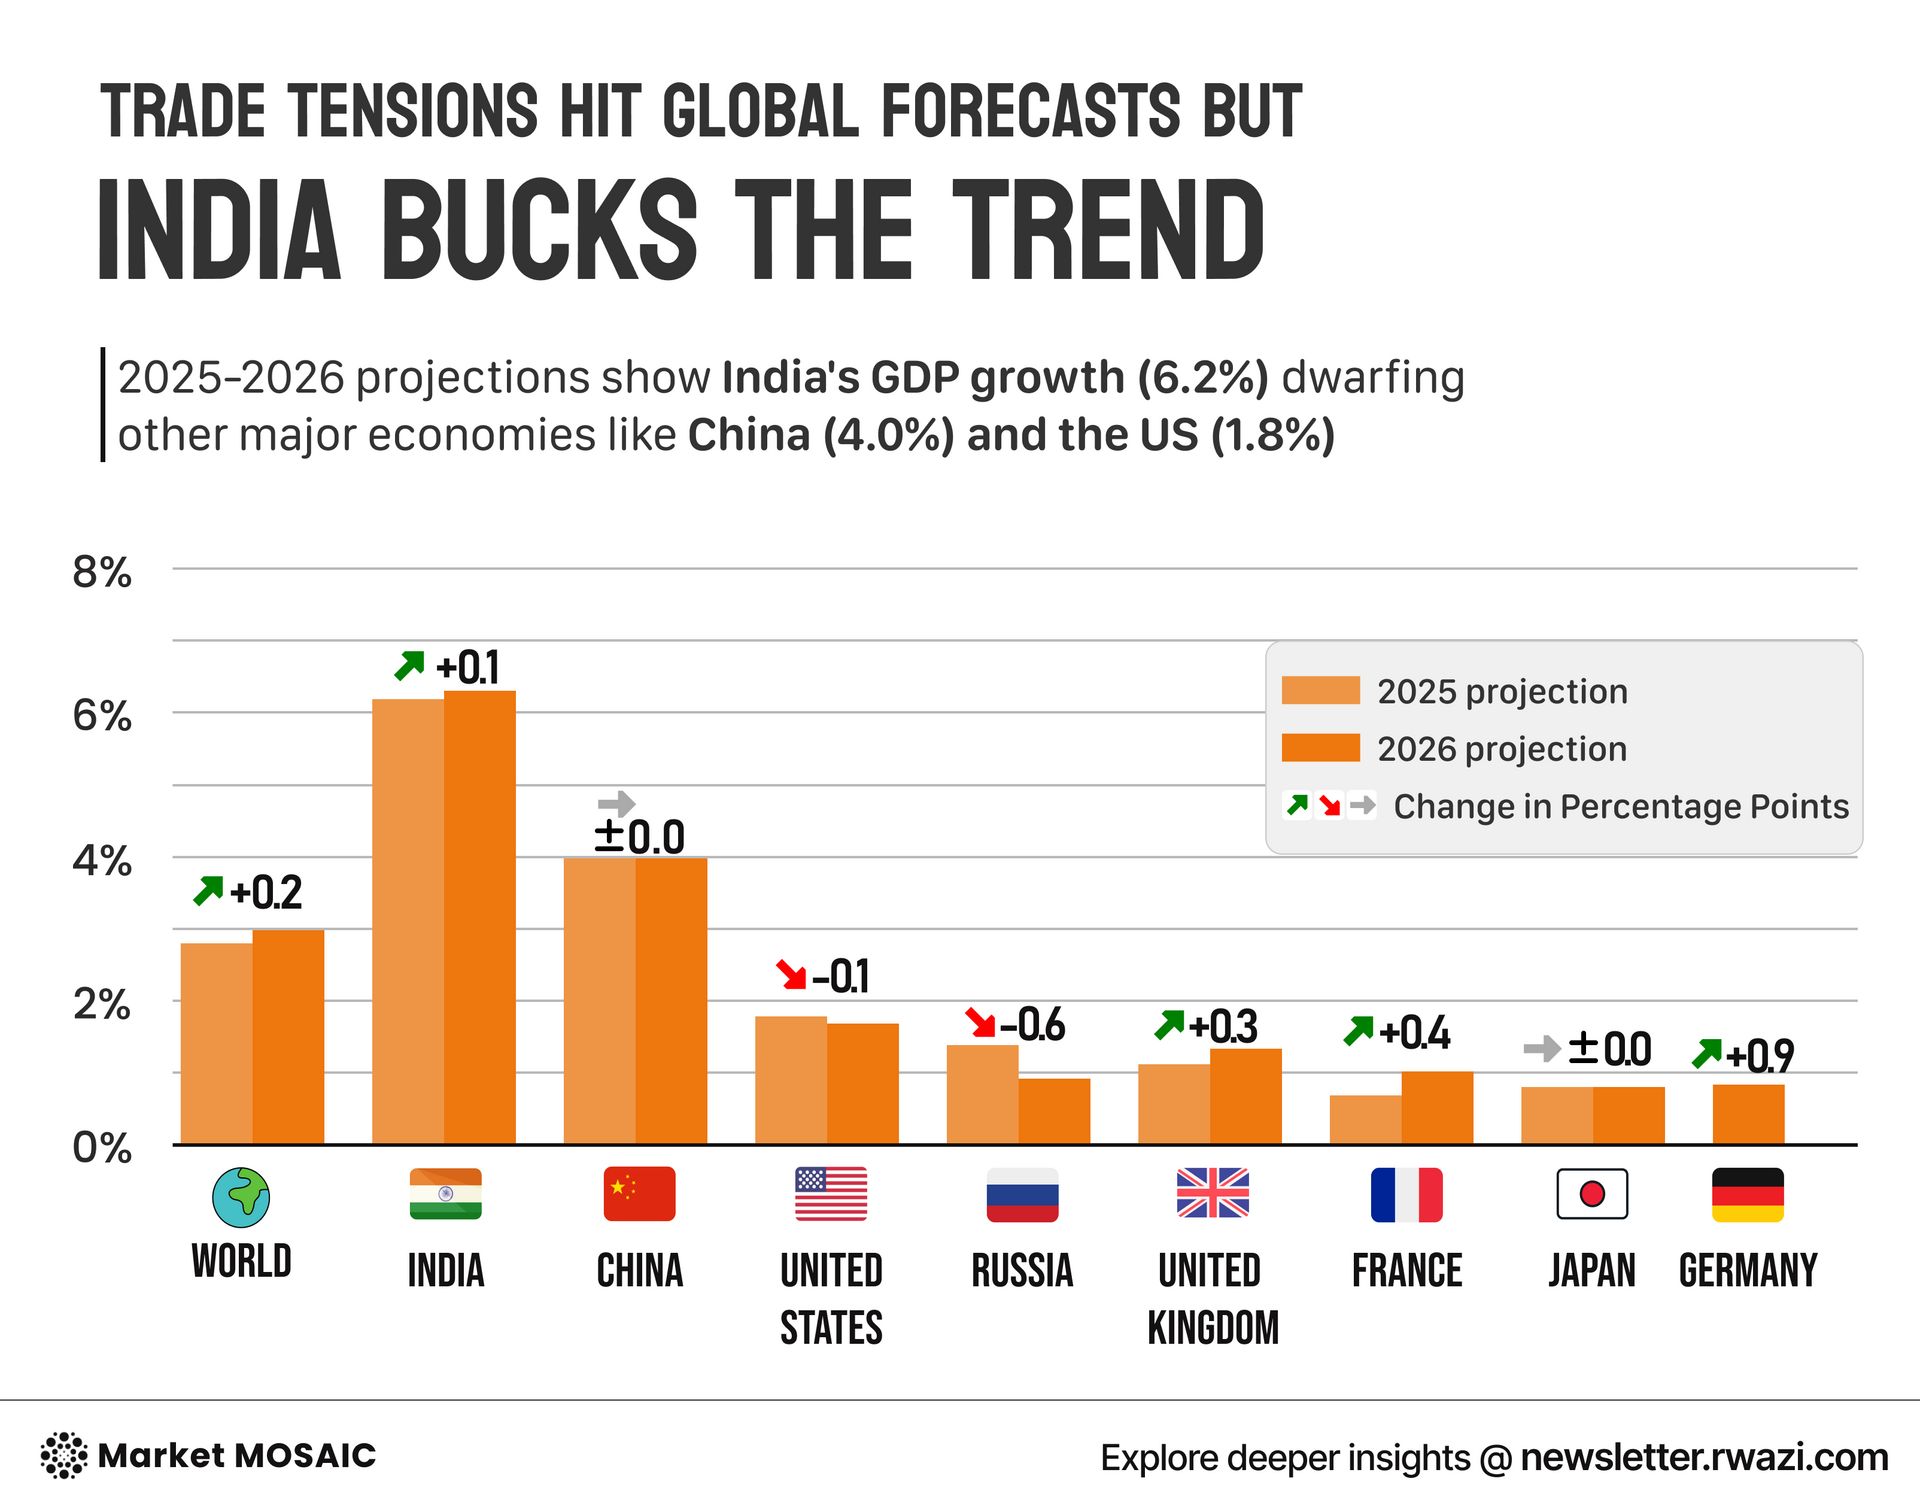
The IMF has downgraded global economic growth to 2.8% for 2025 and 3% for 2026, down from 3.3% previously. Advanced economies face particularly challenging conditions, with growth slowing to just 1.4% in 2025. The United States decelerates from 2.8% in 2024 to 1.8% in 2025, while Germany projects…
 Sector trackerEdition #90
Sector Performance Tracker
The AI ecosystem has transformed. Latest benchmark data shows that no single model dominates across all tasks. GPT-5 leads in reasoning and agentic tasks, Grok 4 dominates coding, while DeepSeek and Qwen close the performance gap at one-hundredth of the cost. We have entered the multi-model era,…
 ChartEdition #89
Nvidia's dominance faces growing competition
While Nvidia commands 80% of the AI chip market with a $4.5 trillion market cap, the real story lies in who's gaining ground fastest. Micron Technology has surged 119% year-to-date, followed by Lam Research at 106% and Intel at 81%. AMD's 69% gain and multi-billion-dollar supply deal with OpenAI…
 ChartEdition #88
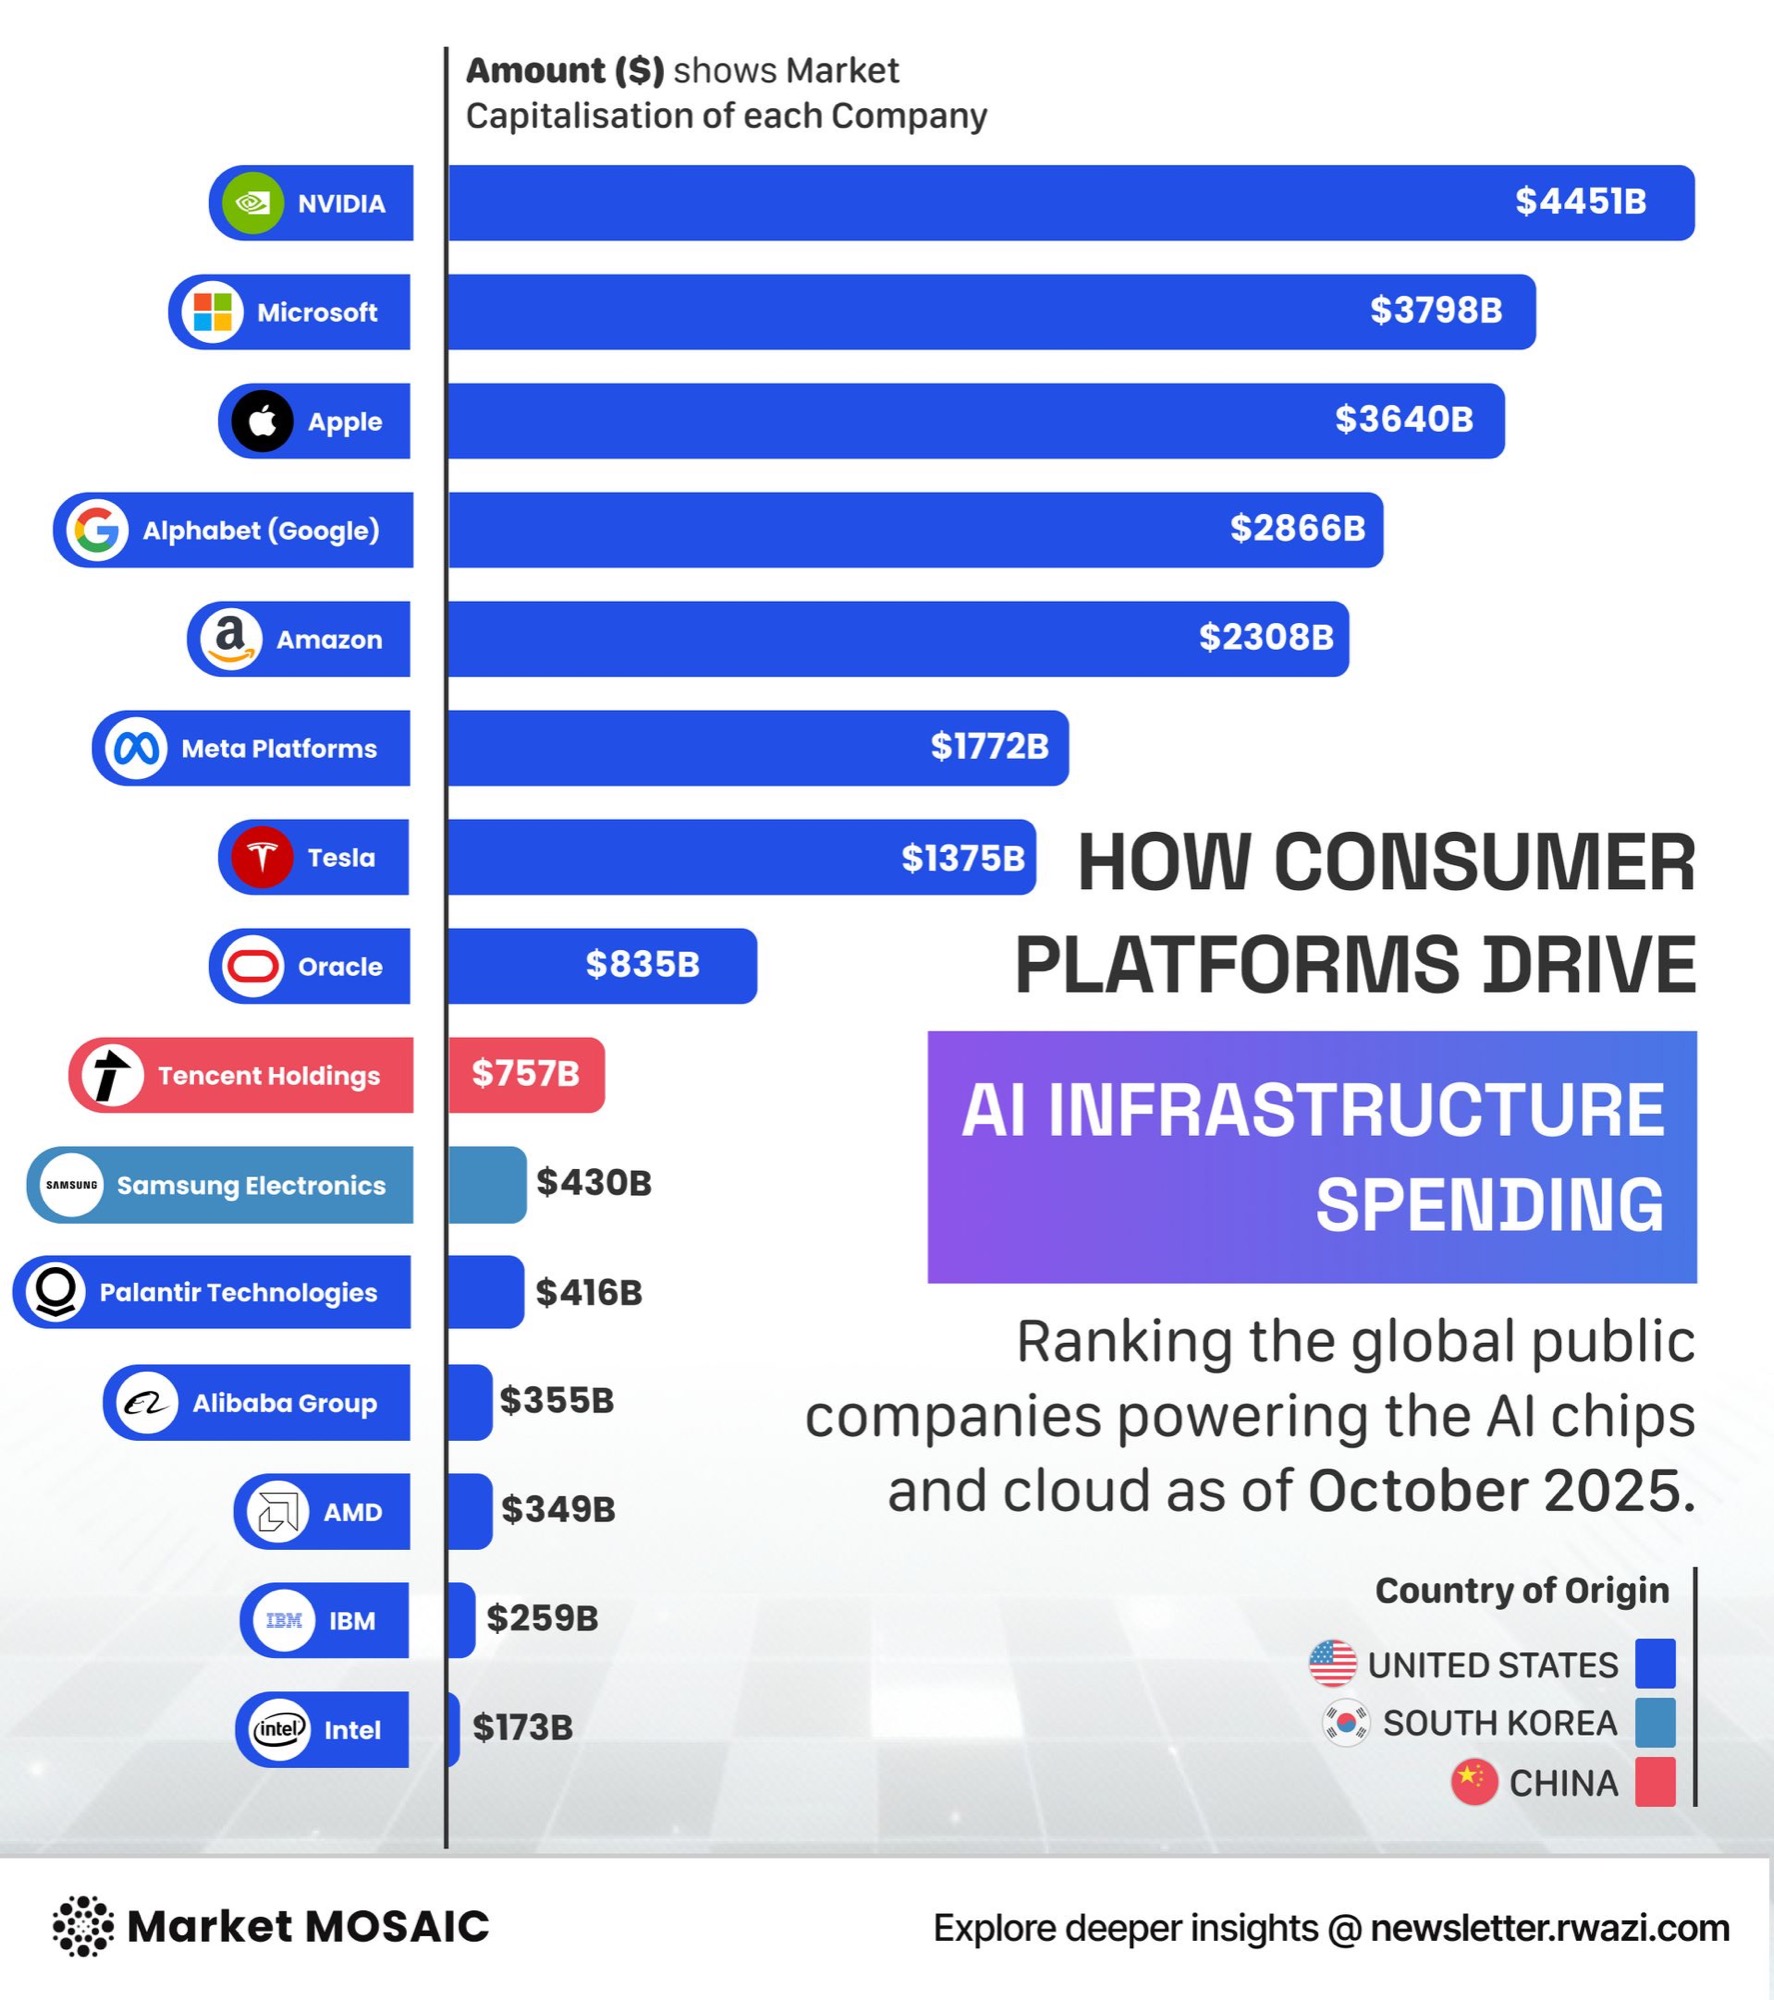
AI infrastructure power consolidates among tech giants
NVIDIA's $4.45 trillion valuation cements its position as the AI revolution's computational backbone. Microsoft ($3.8T), Apple ($3.6T), Alphabet ($2.9T), Amazon ($2.3T), and Meta ($1.8T) dominate the infrastructure layer through which billions interact with AI daily. Asia's champions are mounting a…
 Sector trackerEdition #88
Sector Performance Tracker
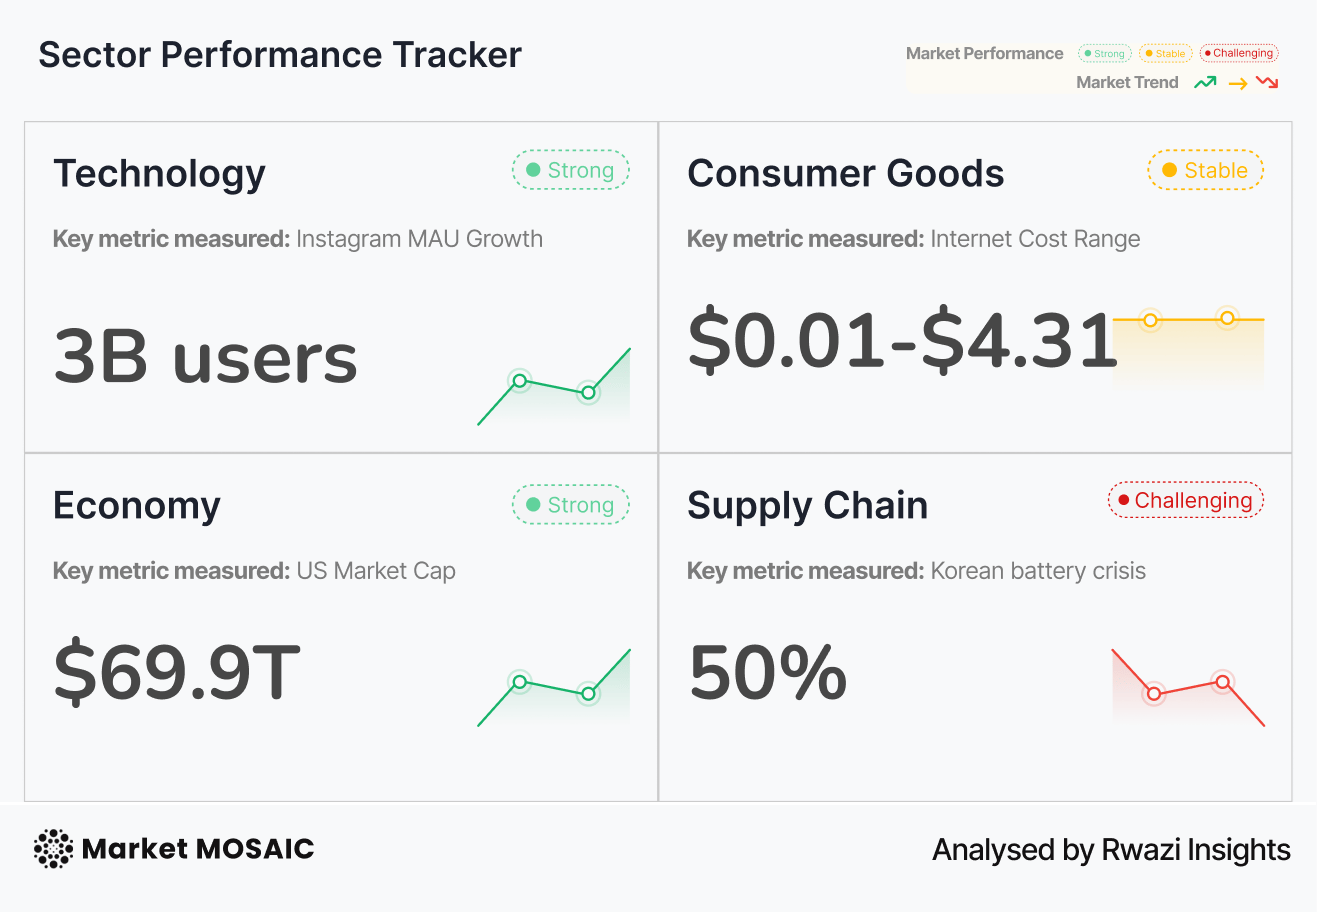
NVIDIA's $4.45 trillion valuation cements its position as the AI revolution's computational backbone. Microsoft ($3.8T), Apple ($3.6T), Alphabet ($2.9T), Amazon ($2.3T), and Meta ($1.8T) dominate the infrastructure layer through which billions interact with AI daily. Asia's champions are mounting a…
 Sector trackerEdition #86
Sector Performance Tracker
We recently redesigned our newsletter product with a fresh new look to make it clearer, easier to navigate and more engaging for you as a user. And we would love your feedback.
 ChartEdition #86
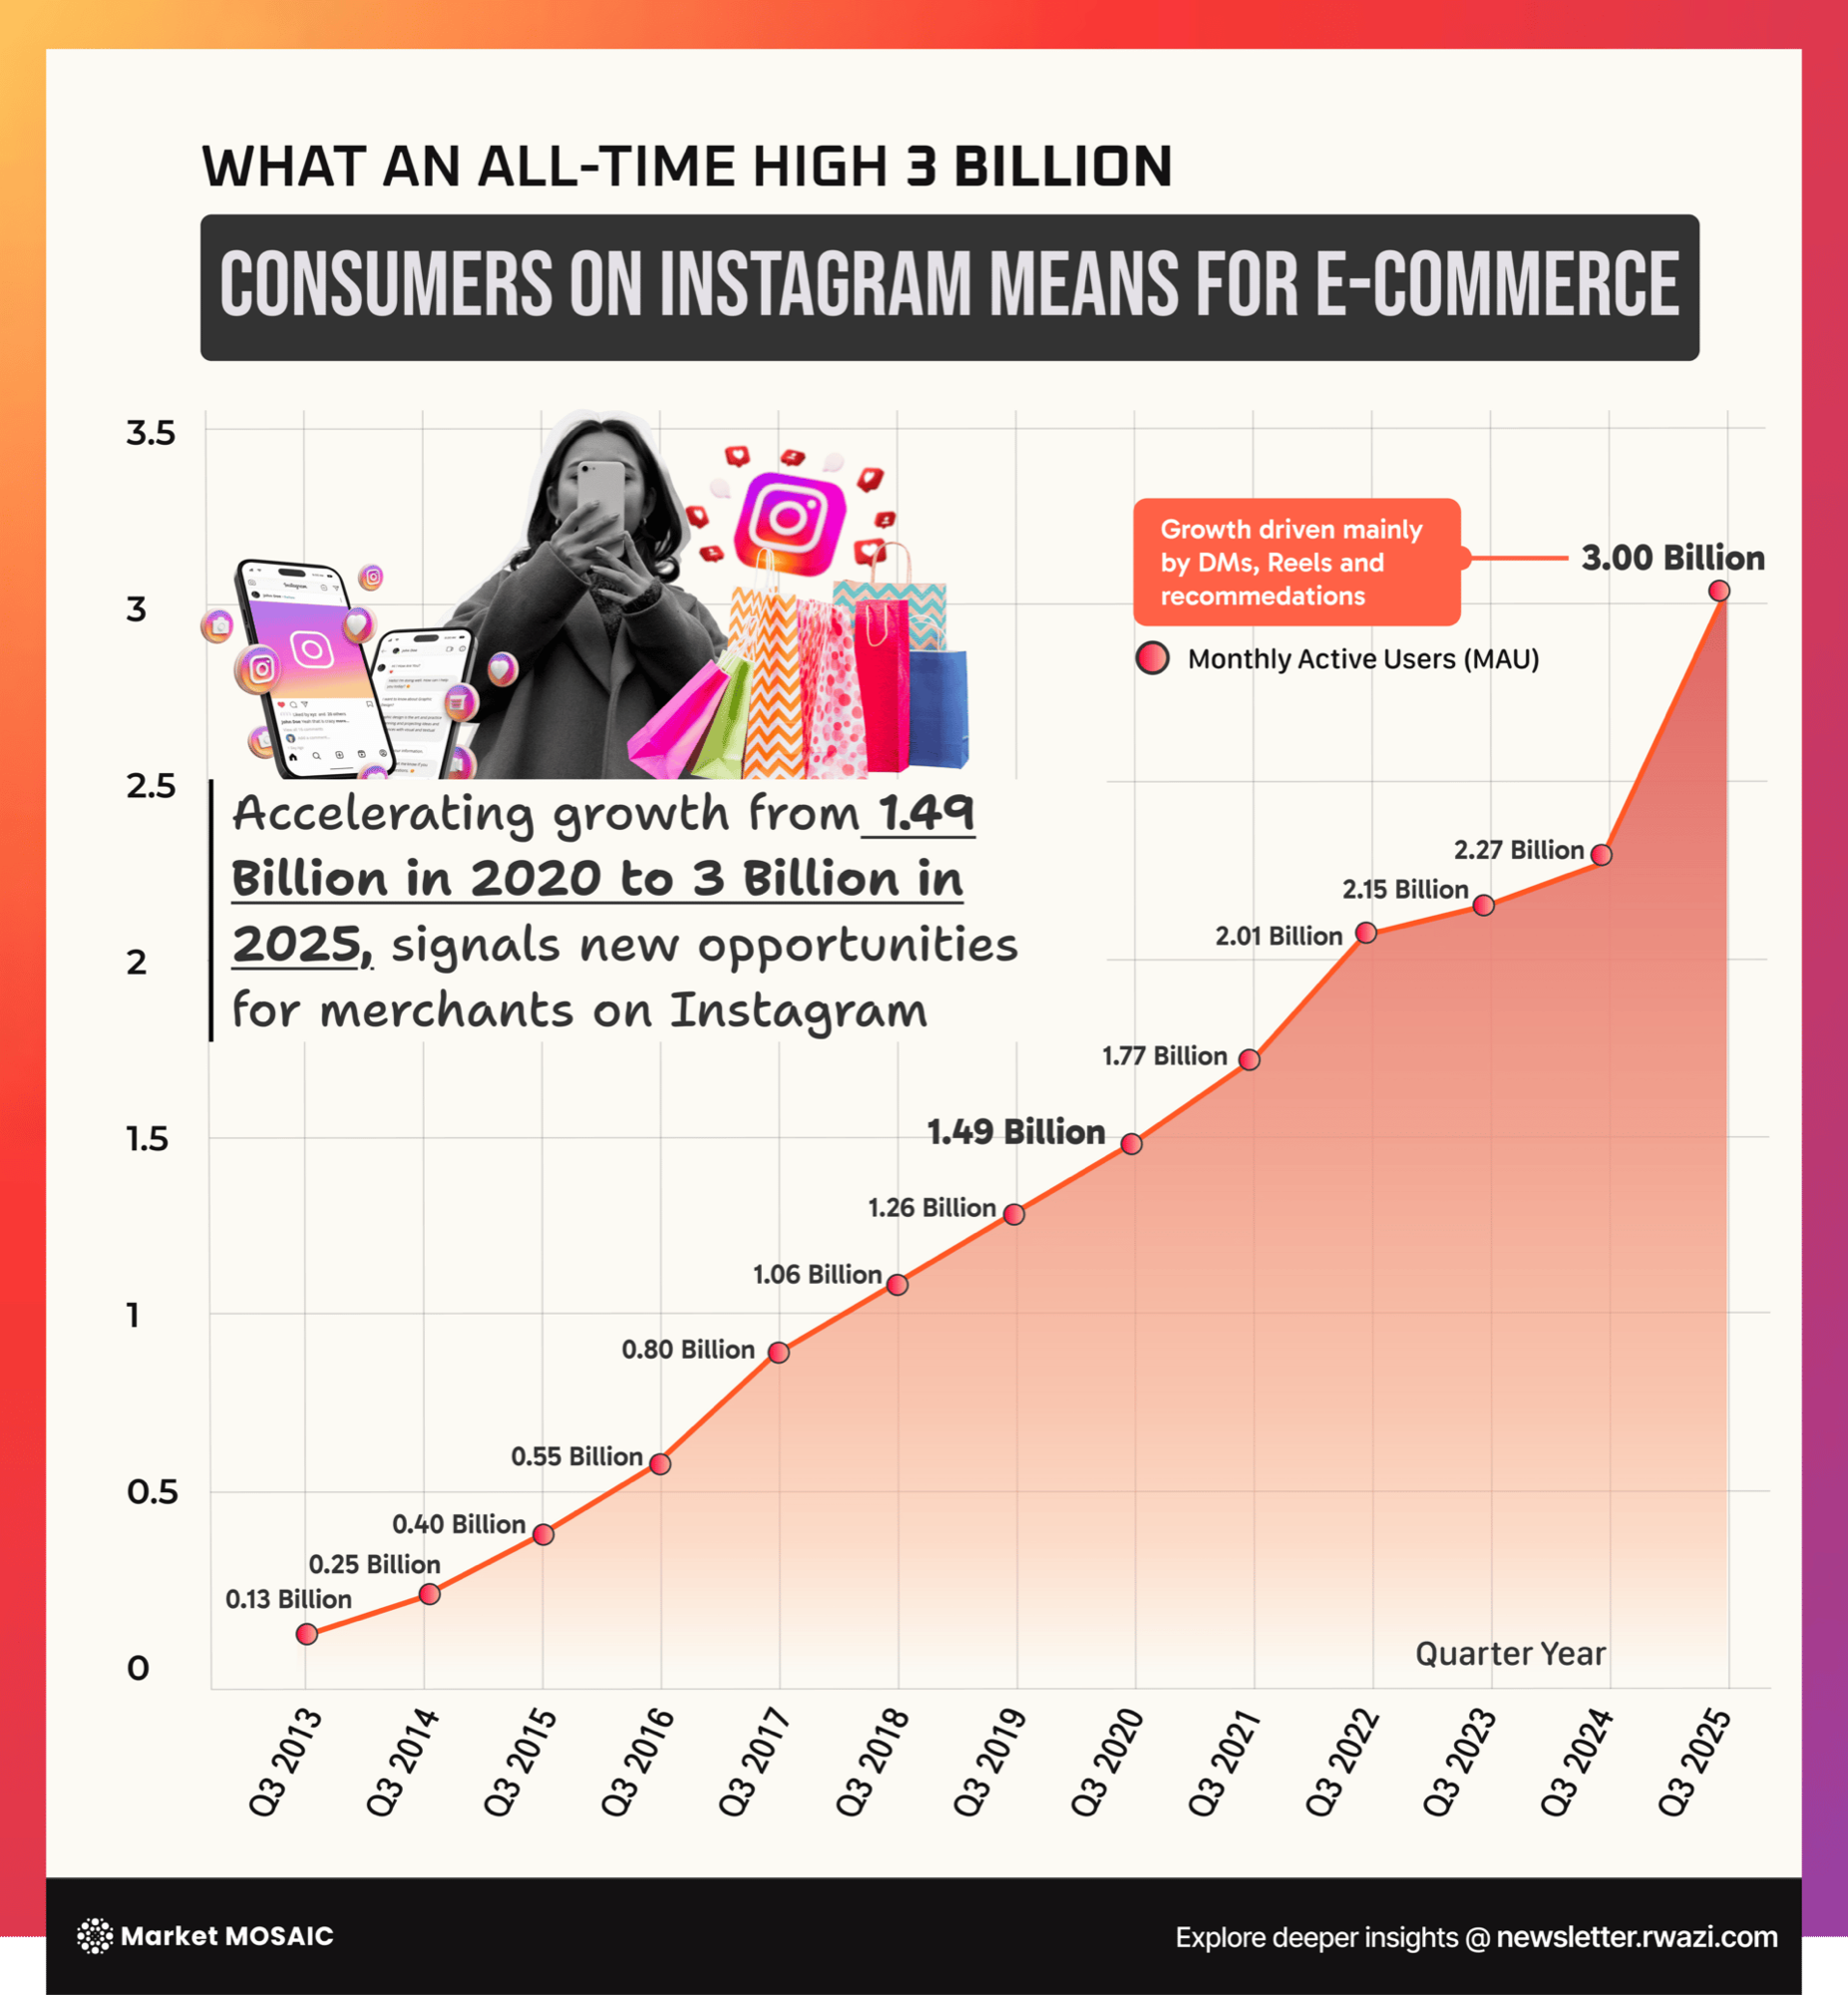
Instagram's 3 billion user milestone signals growth for e-commerce
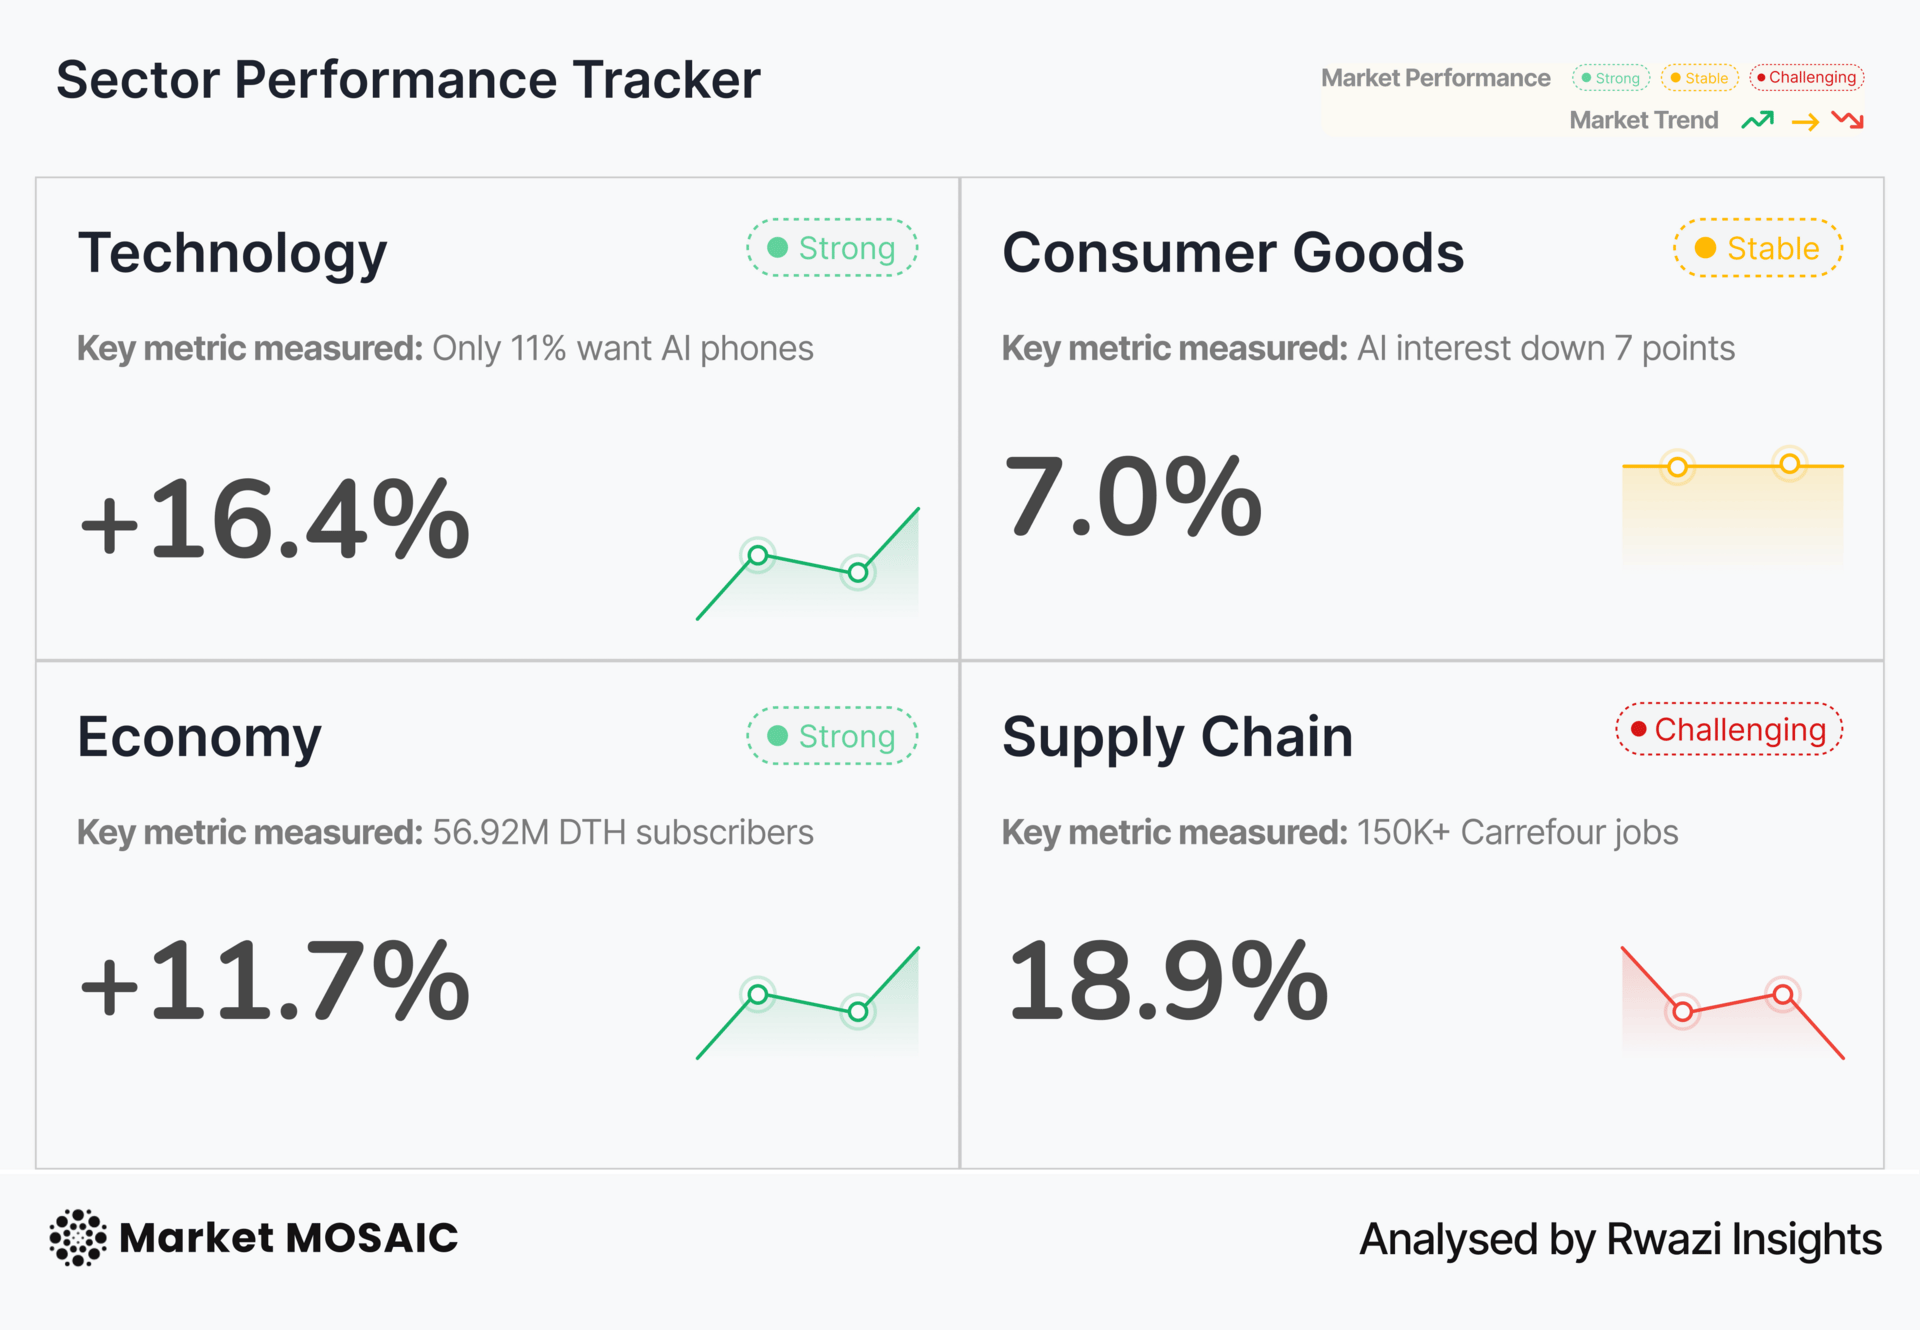
Instagram has crossed three billion monthly active users. And this will create unprecedented opportunities for merchants and brands seeking to reach global consumers. This milestone reflects how billions of people now discover products, interact with brands, and make purchasing decisions in a…
 Sector trackerEdition #85
Sector Performance Tracker
AI is already challenging how products are built, but only a few leaders see what’s coming next. We compiled 35+ pages of market data and predictions. Now, you can know what’s ahead.
 ChartEdition #85
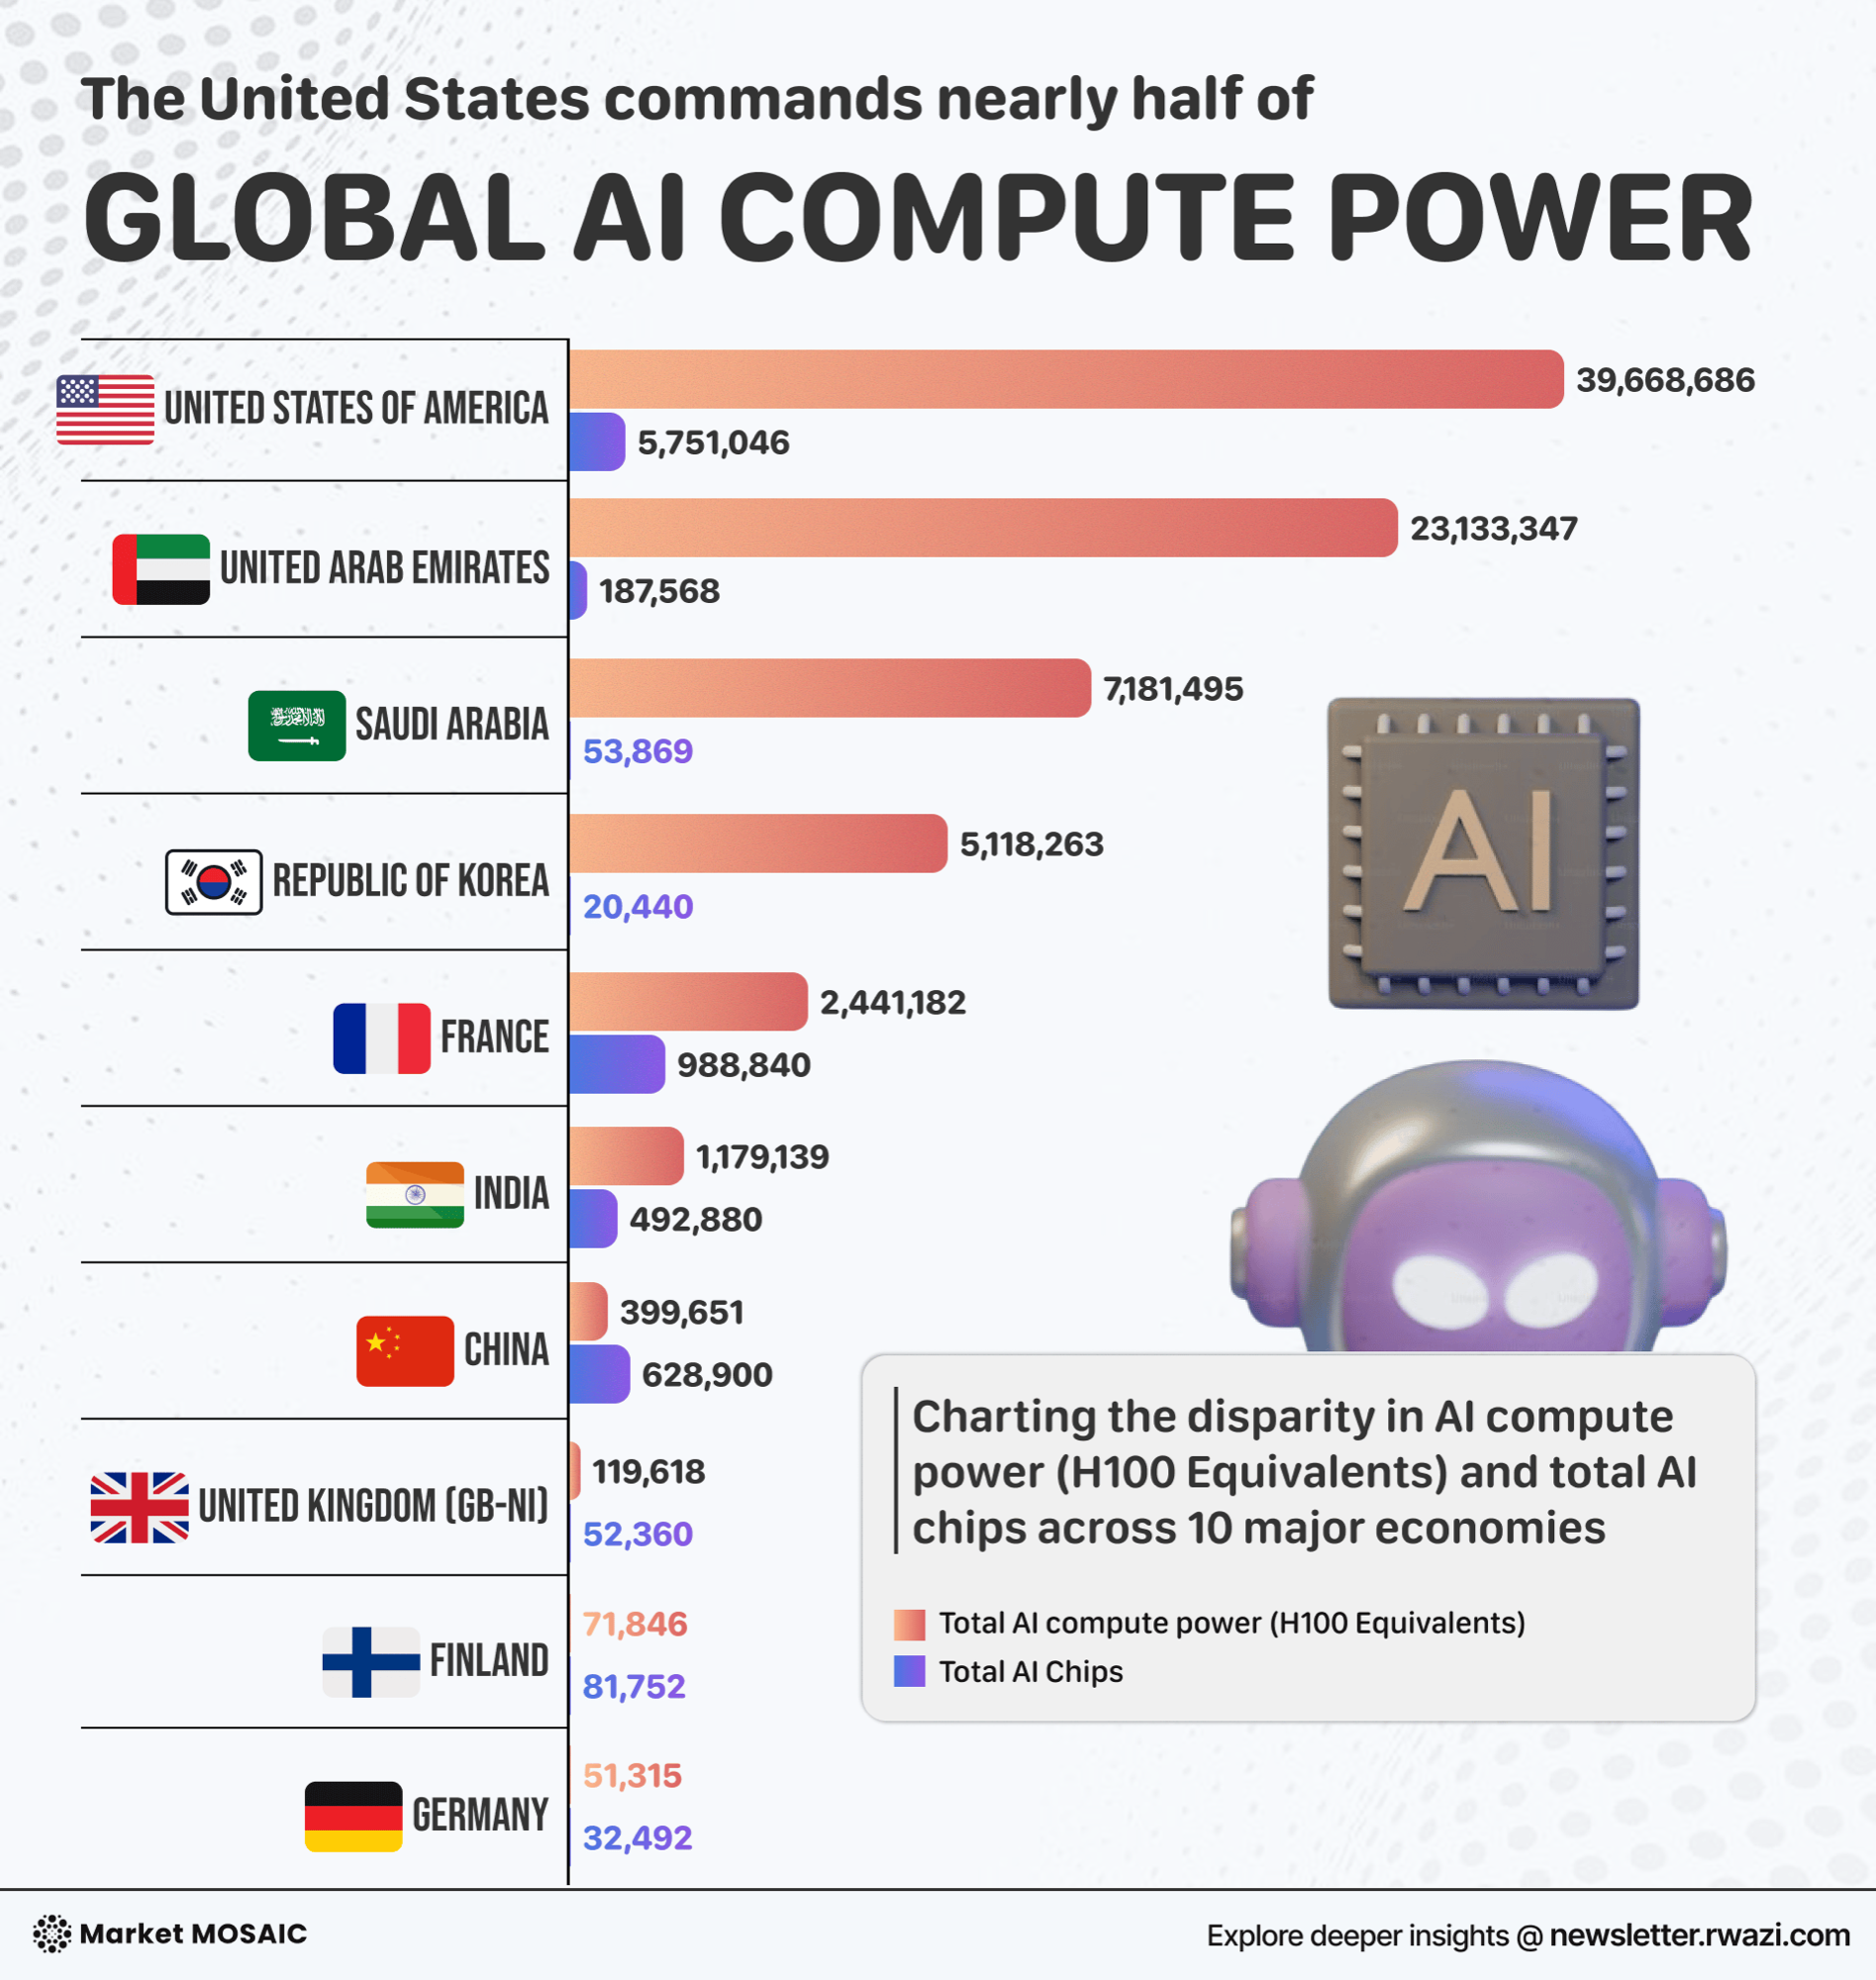
AI compute power is concentrated in a few hands
Data analysis by Rwazi Insights shows this stark reality in global AI infrastructure: computing power is becoming the new oil, and it's heavily concentrated among a select few nations. The United States dominates with nearly 40 million H100 equivalents, representing almost half of global compute…
 Sector trackerEdition #84
Sector Performance Tracker
AI is already challenging how products are built, but only a few leaders see what’s coming next. We compiled 35+ pages of market data and predictions. Now, you can know what’s ahead.
 ChartEdition #84
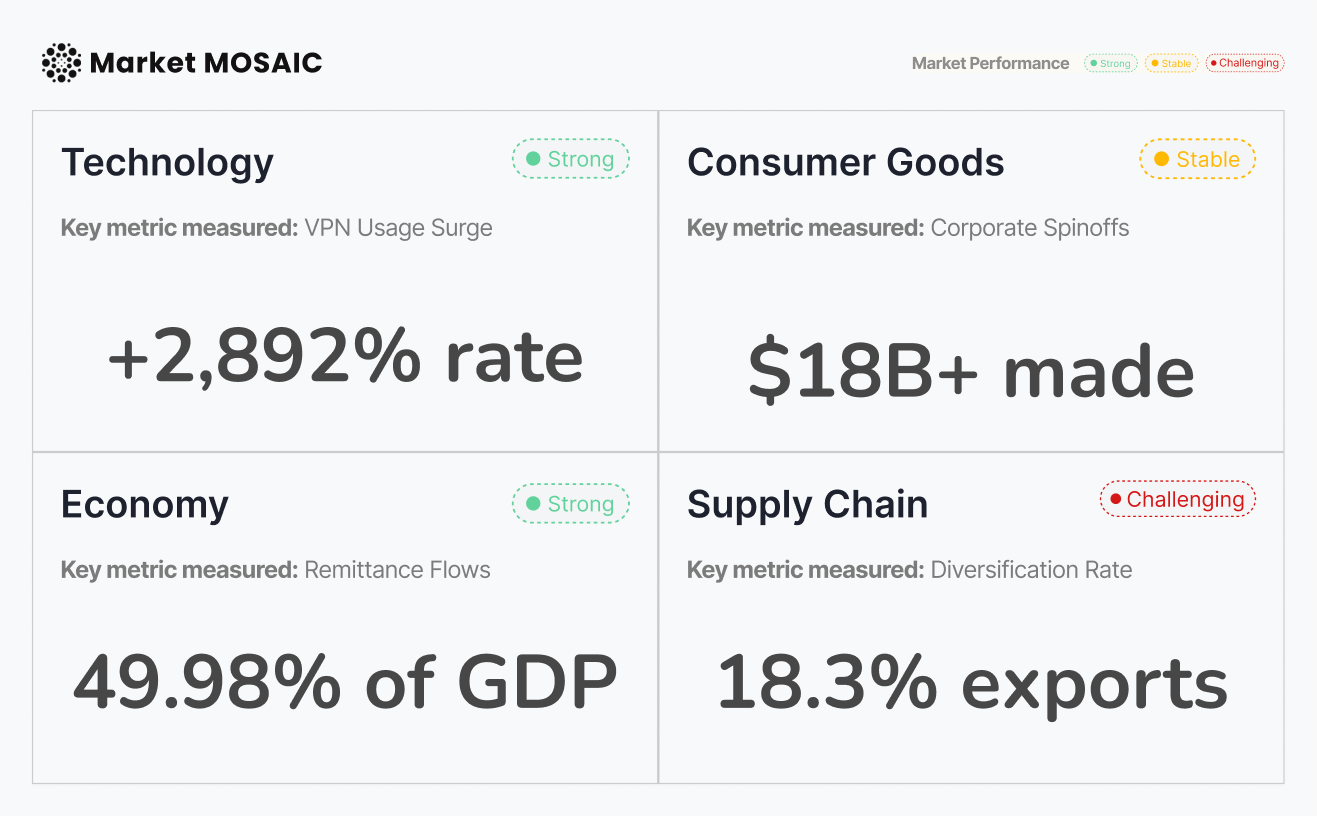
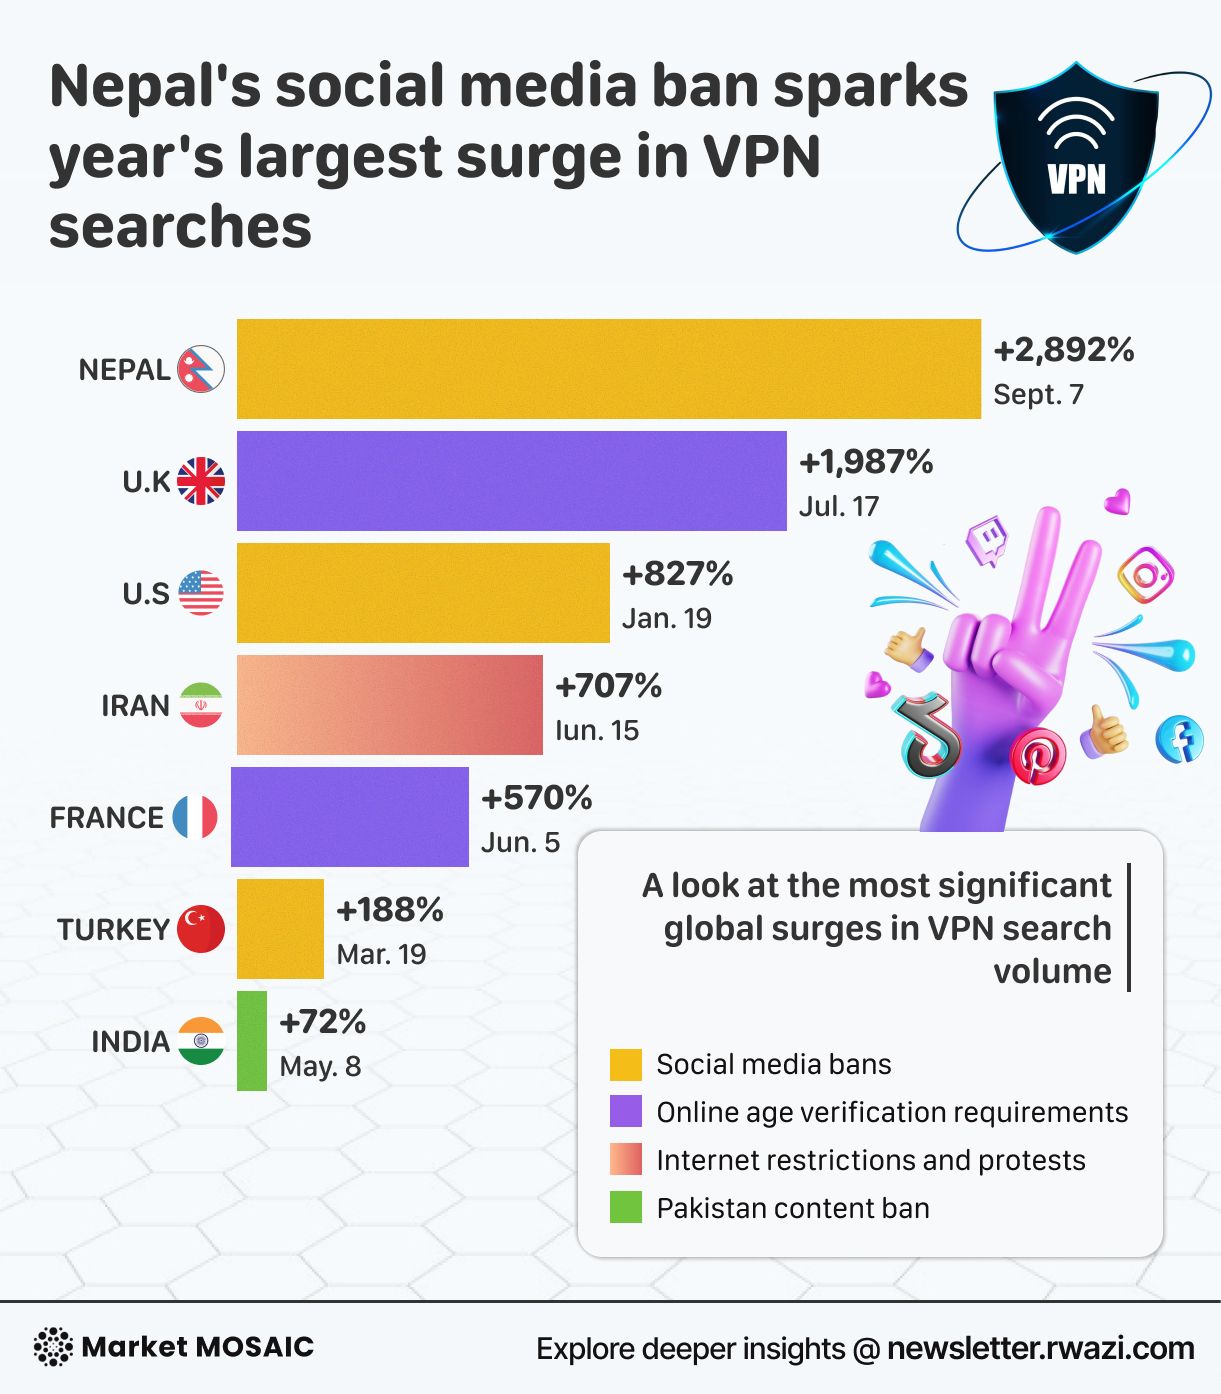
Digital censorship drives mass VPN adoption globally
Our analysis of VPN search data shows unprecedented spikes in demand when governments attempt to restrict digital access. Nepal's social media ban generated a 2,892% increase in VPN searches, the highest recorded globally this year. This pattern repeats across diverse markets: the UK saw 1,987%…
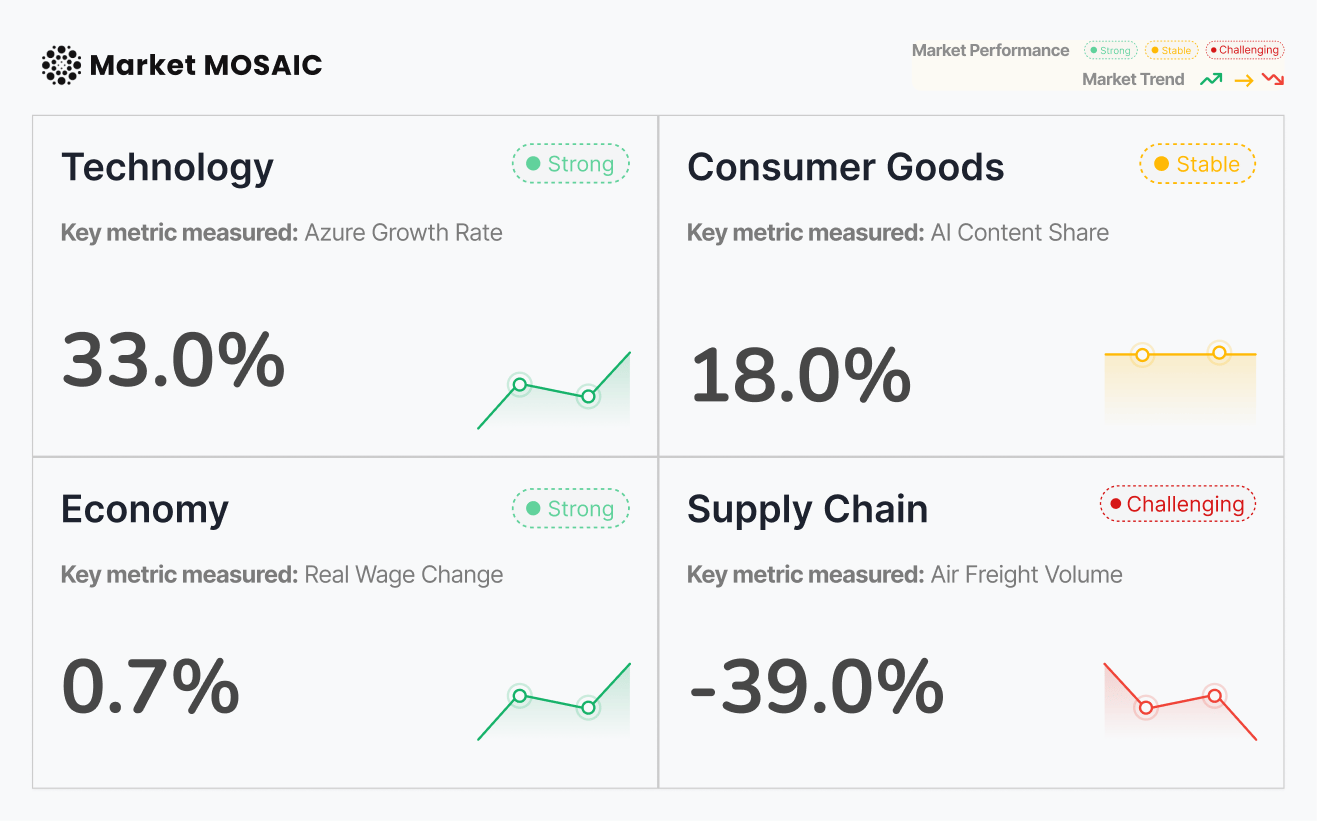 Sector trackerEdition #83
Sector Performance Tracker
AI is already challenging how products are built, but only a few leaders see what’s coming next. We compiled 35+ pages of market data and predictions. Now, you can know what’s ahead.
 ChartEdition #83
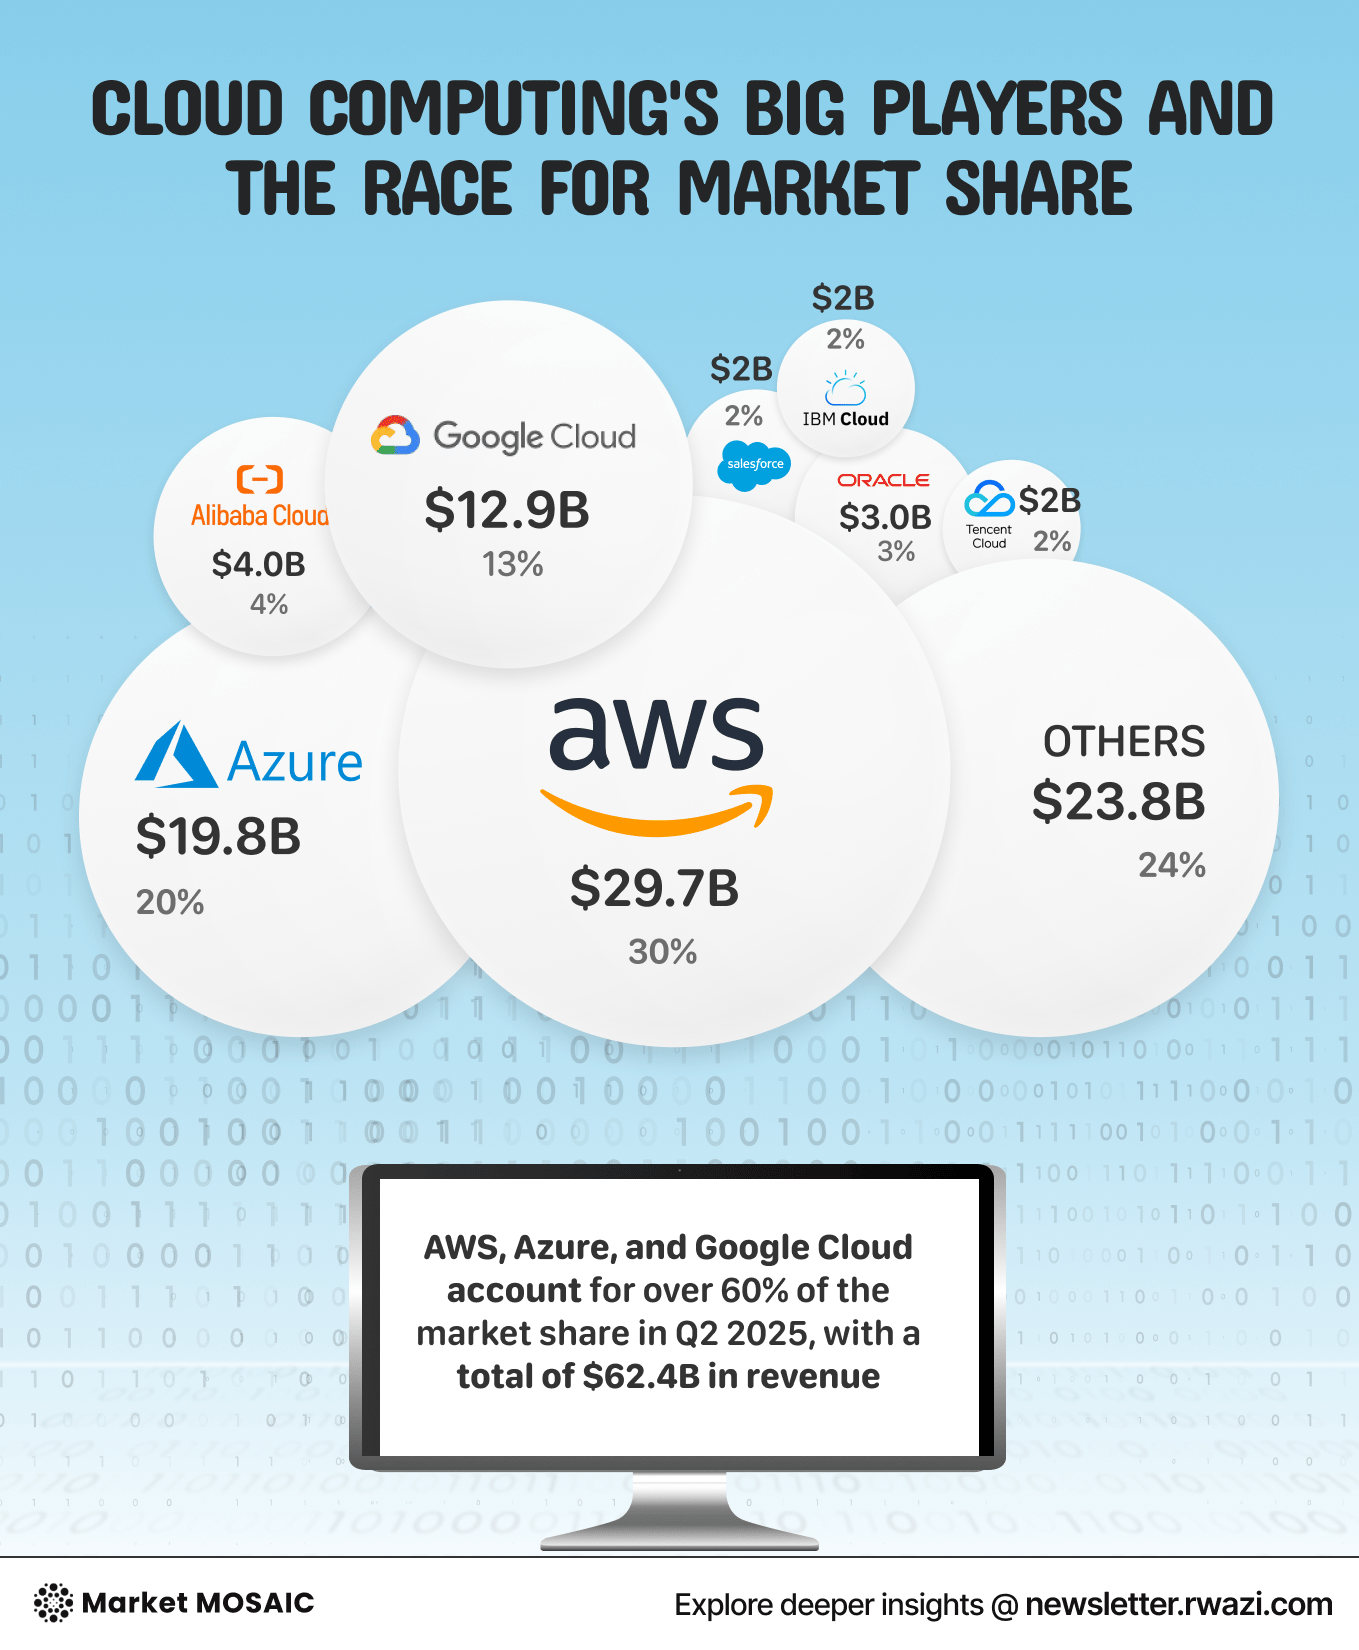
Cloud wars intensify as AWS dominance is challenged by AI-driven growth
Amazon Web Services continues its reign as the cloud computing king, now approaching $120 billion in annual revenue and surpassing iconic brands like Nike, Coca-Cola, and Disney. However, the competition is growing than ever, with Microsoft Azure emerging as a formidable challenger. According to…
 ChartEdition #82
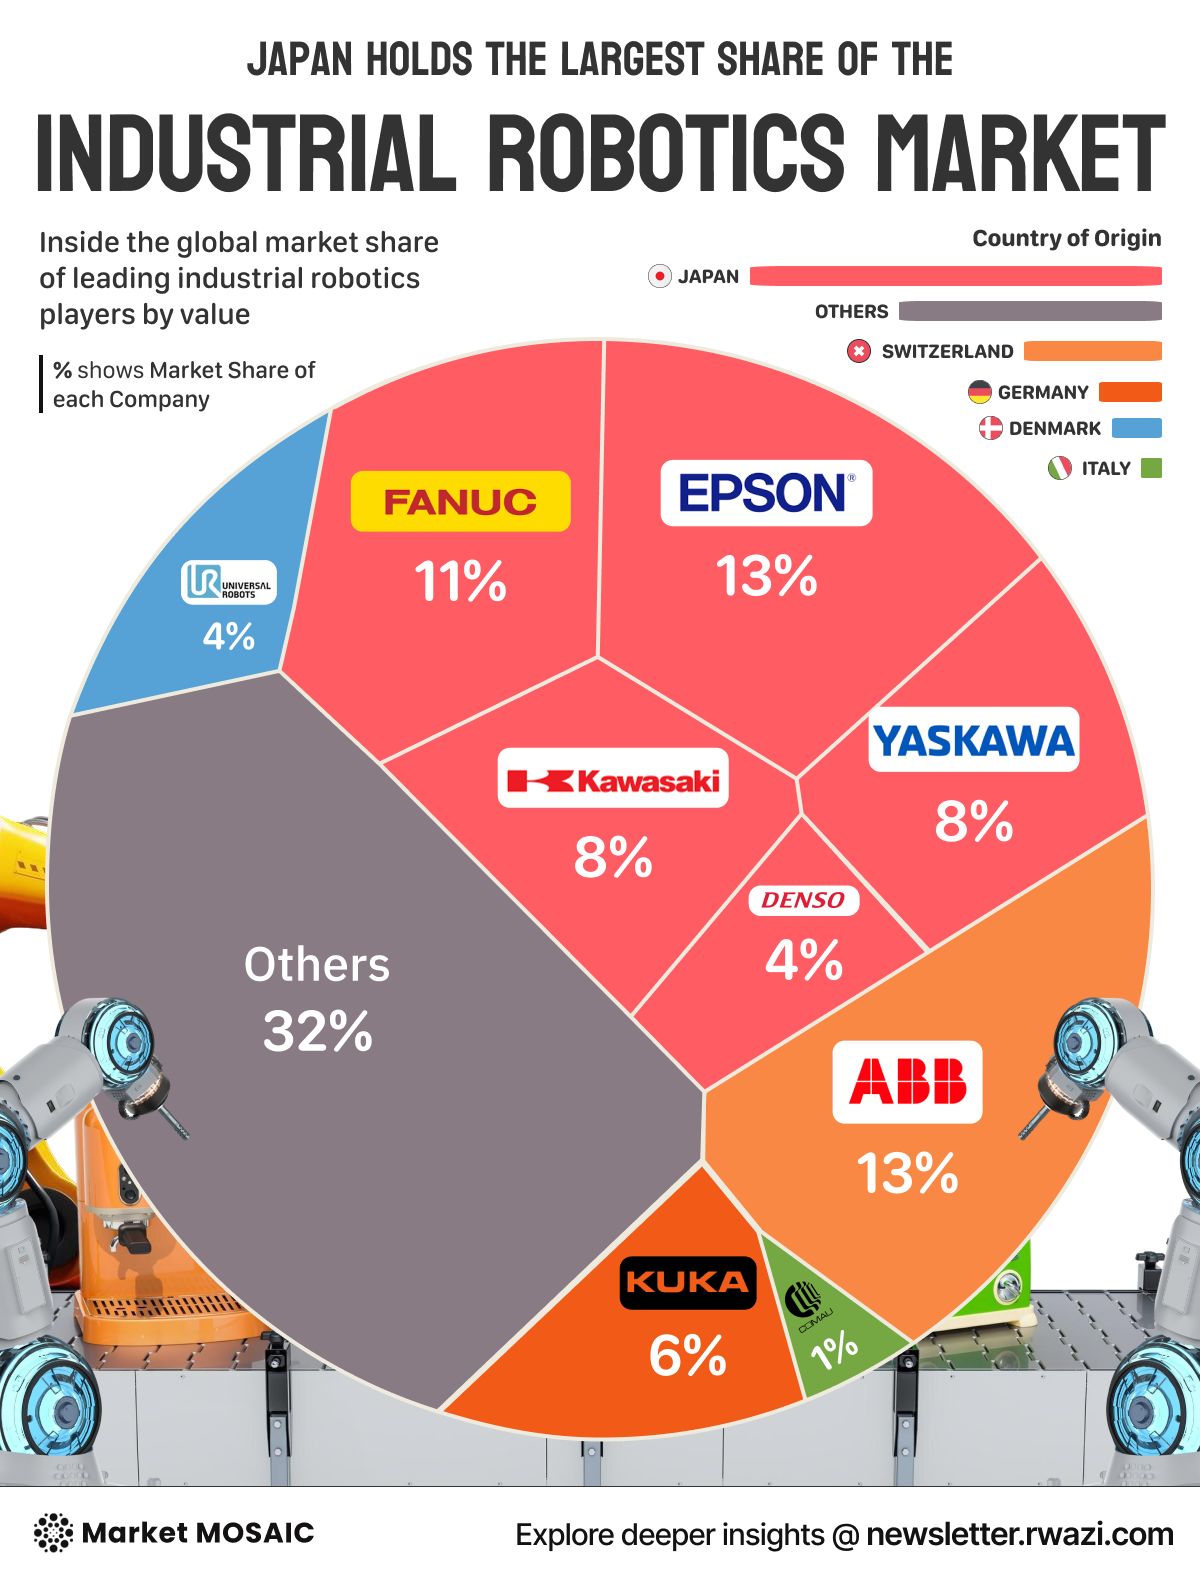
Industrial robotics now accelerates consumer expectations
The industrial robotics market reaching $10.2 billion in 2025 signals a shift in how consumers will experience products and services. With automotive (30%) and electronics (27%) leading robot installations, consumer expectations for product quality, customisation, and delivery speed are being…
 ChartEdition #81
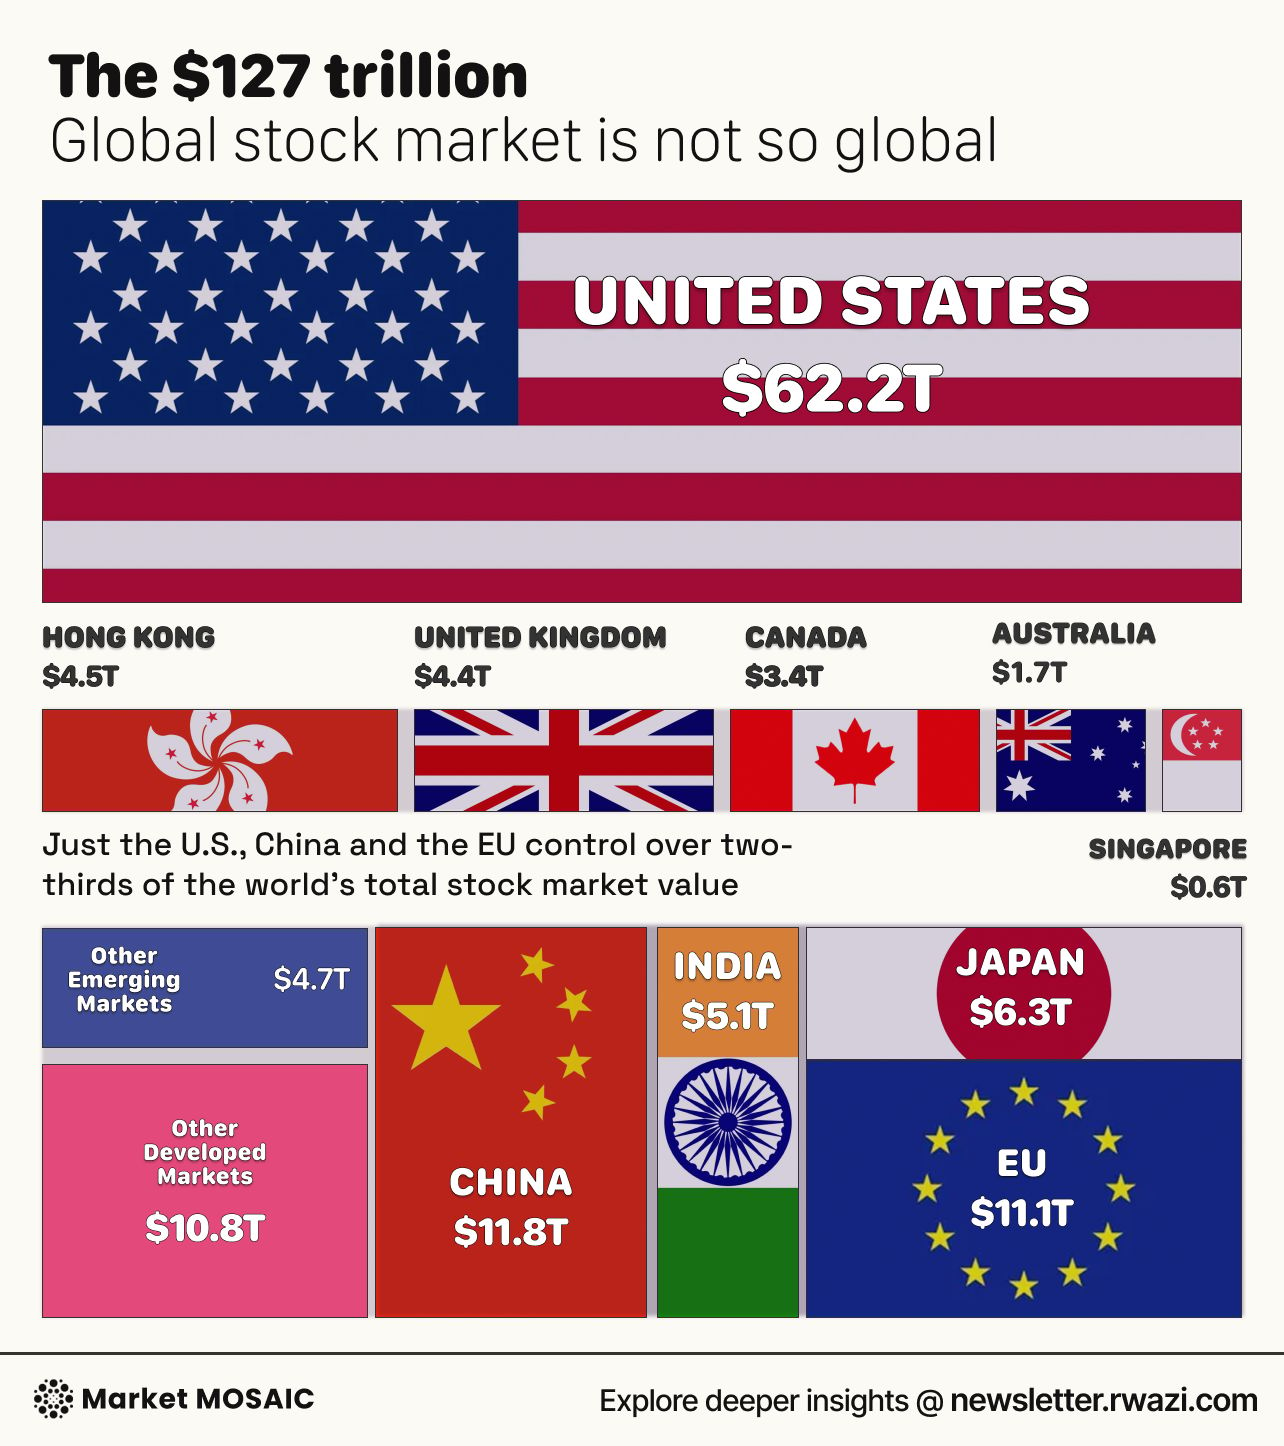
Global stock market validates consumer investment patterns
The global stock market's $127 trillion value tells a compelling story about consumer behavior and investment preferences while showcasing a stark geographic concentration. Nearly half of this value, $62.2 trillion, resides in US markets, showing both institutional strength and global consumer…
 ChartEdition #80
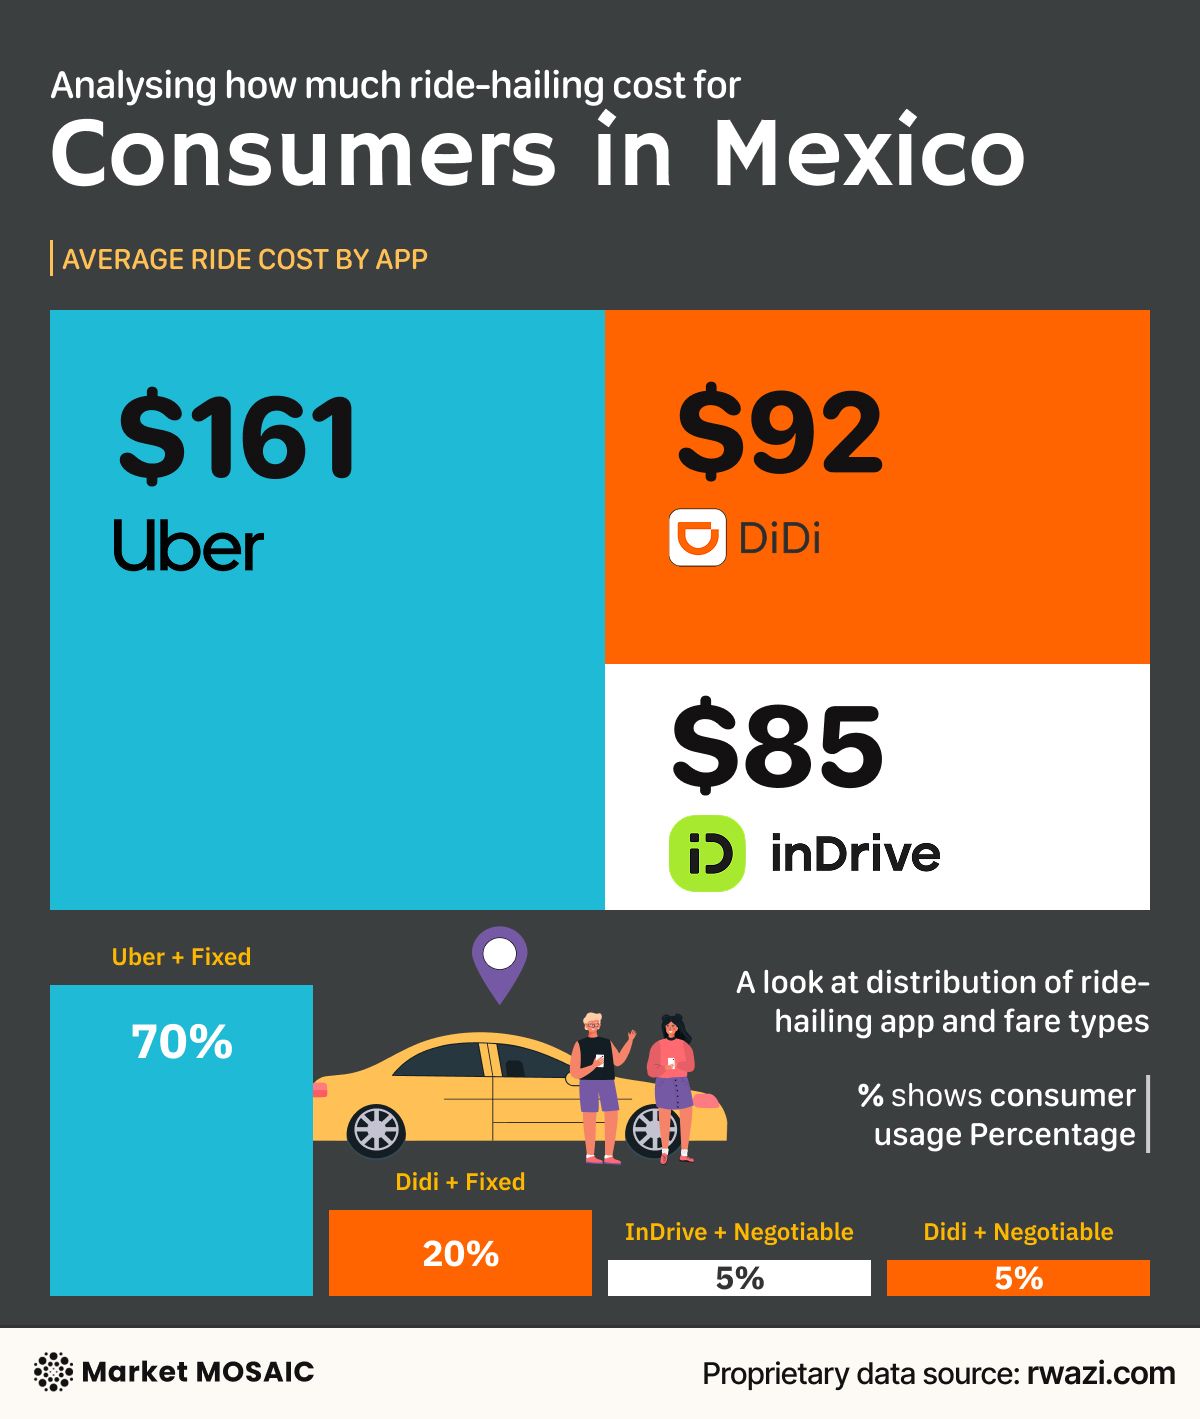
Rideshare’s price sensitivity drives market dynamics in Mexico
Our proprietary data from Mexico shows fascinating consumer behavior patterns in the rideshare market, where price sensitivity trumps brand loyalty. The data shows Uber commanding premium pricing at $161 MXN per ride, while DiDi ($85) and inDrive ($92) capture price-conscious consumers. Consumer…
 ChartEdition #79
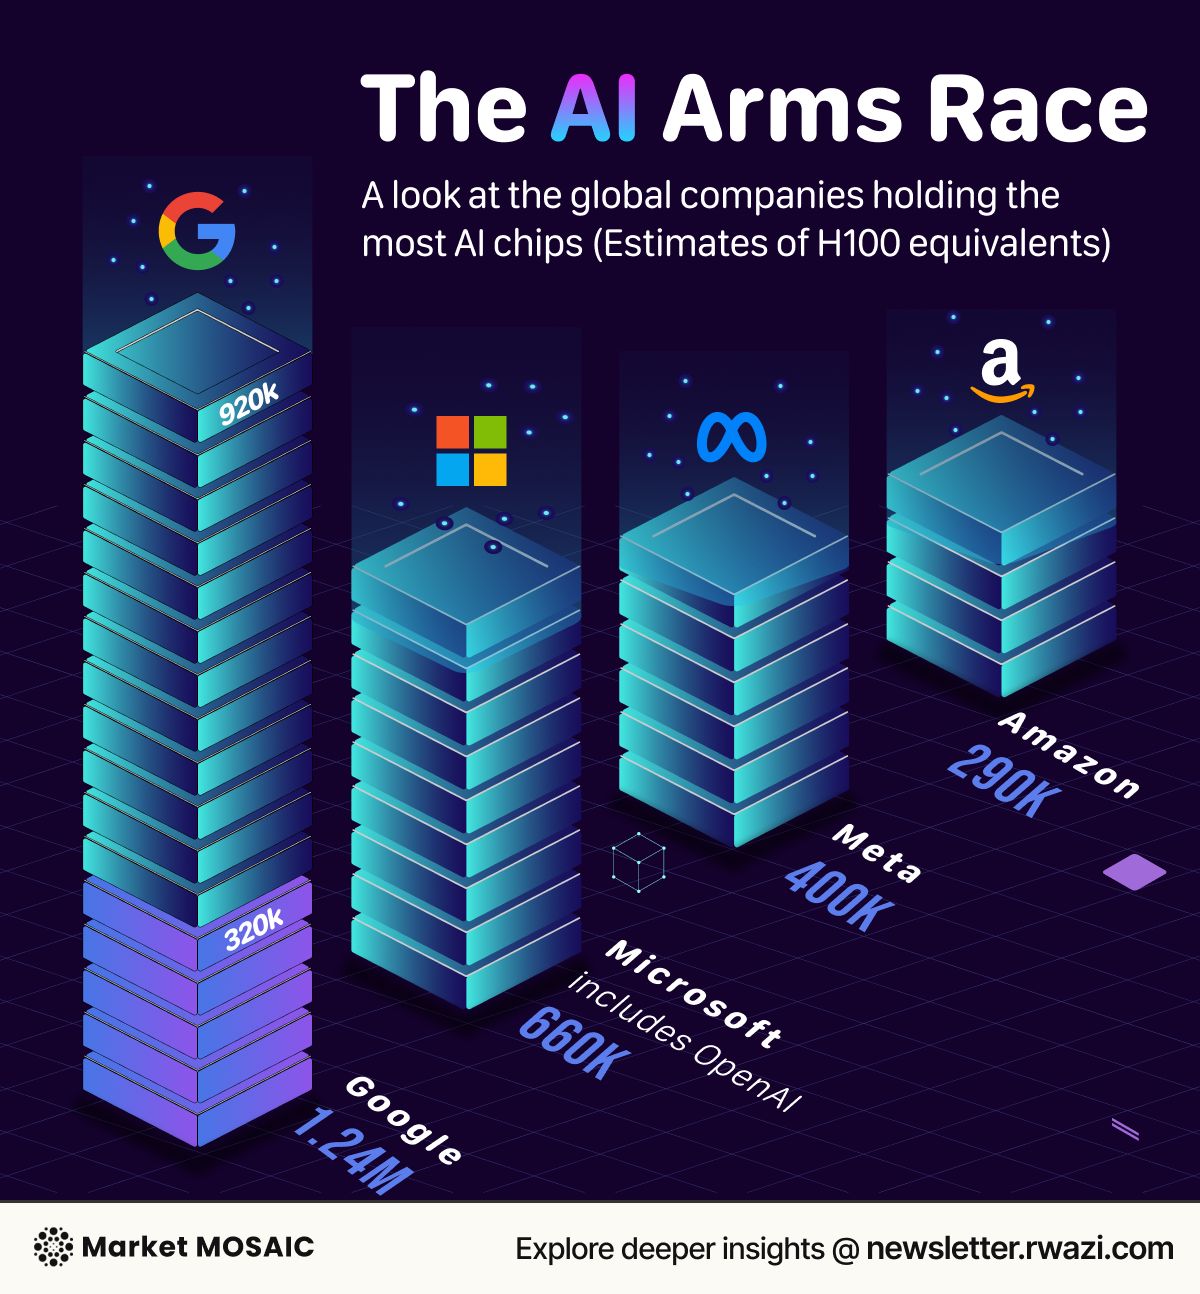
Supply Chain
Our analysis of chip infrastructure investments shows a stark competitive space that's challenging the technology sector. Google emerges as the undisputed leader in AI computing power with an estimated 1.24 million H100-equivalent chips, significantly outpacing its closest competitors. The Power…
 ChartEdition #78
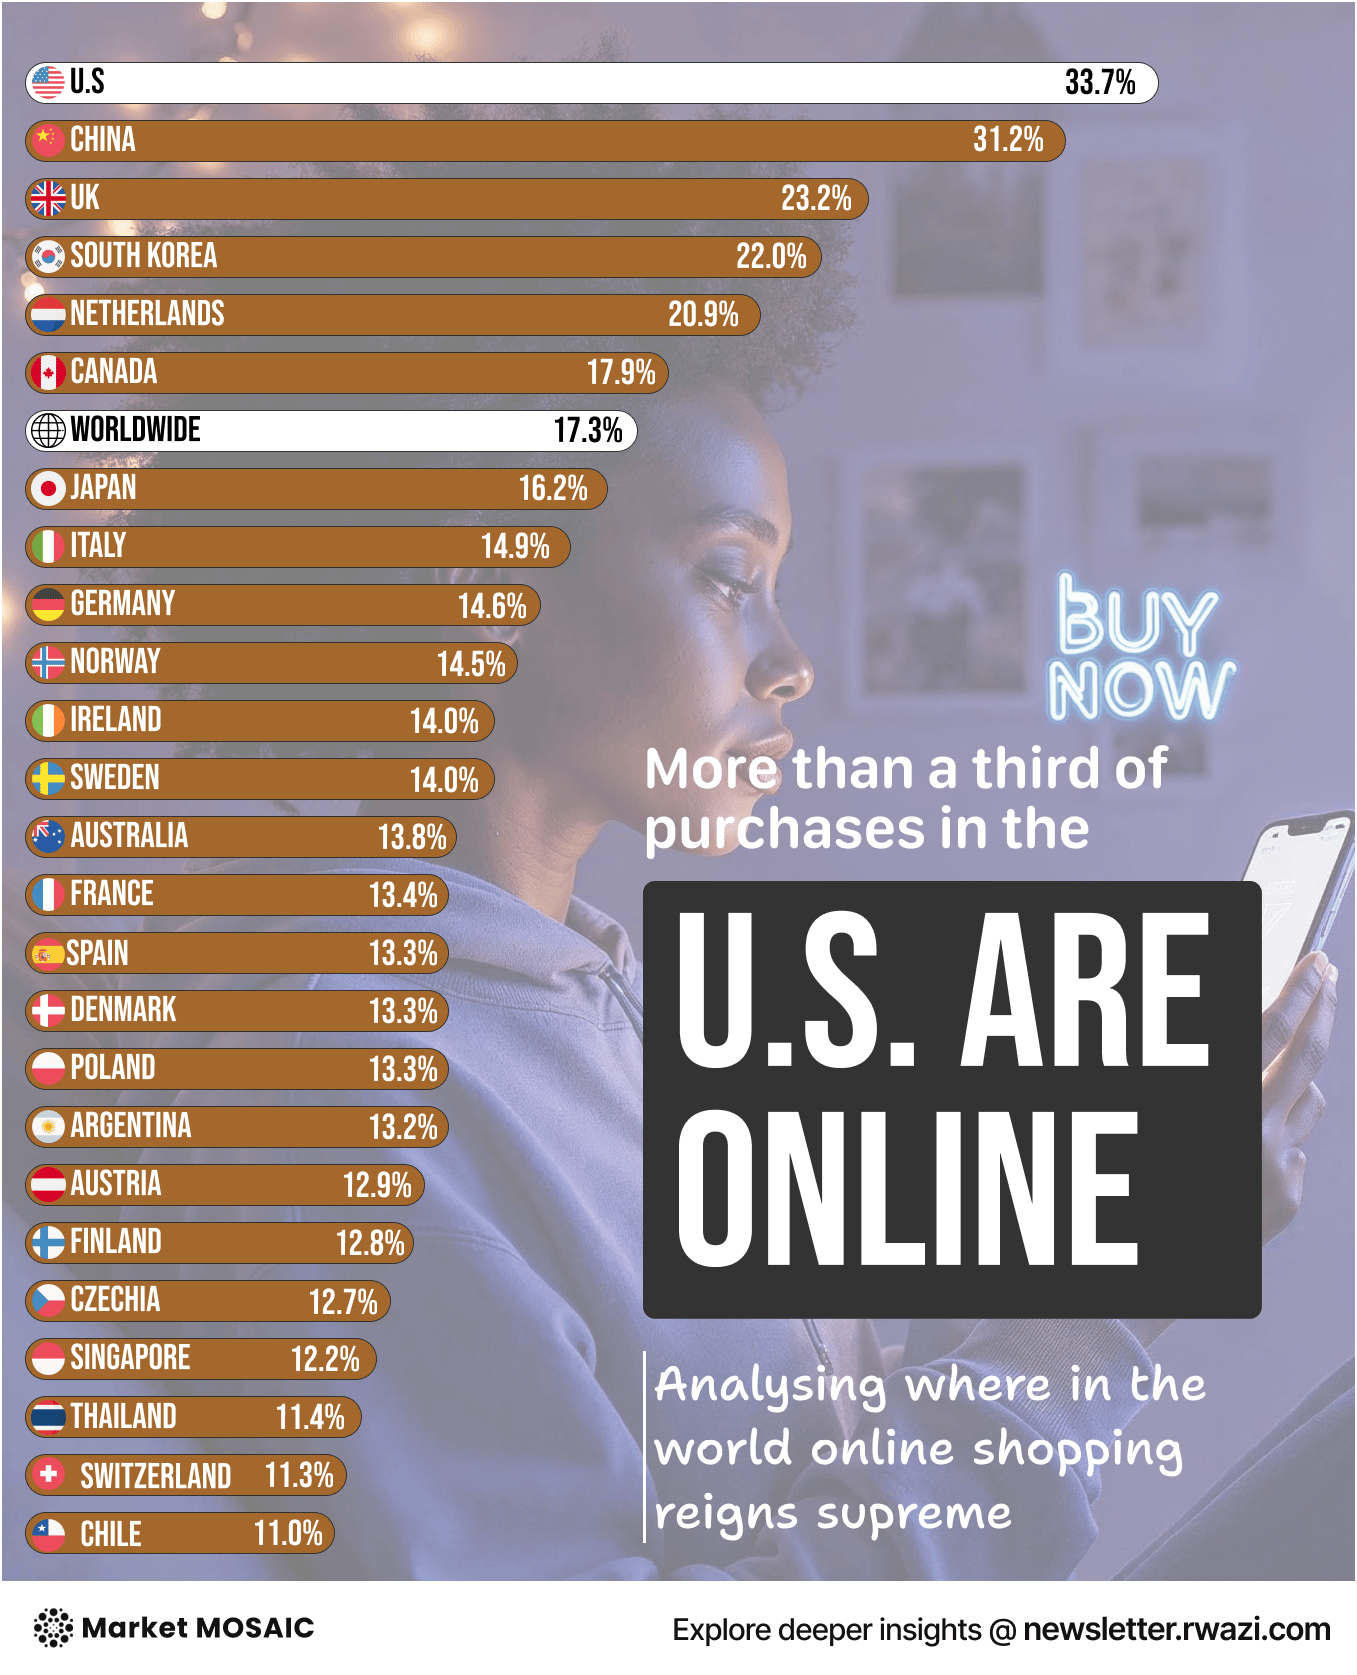
Inside the 426B liters, 33.7% market share & $5.6B partnership
Our analysis of global e-commerce penetration over the last month shows real differences in consumer digital adoption across markets. The United States leads at 33.7% of consumer goods purchased online, followed closely by China at 31.2%, both far exceeding the global average of 17.3%. Countries…
 ChartEdition #77
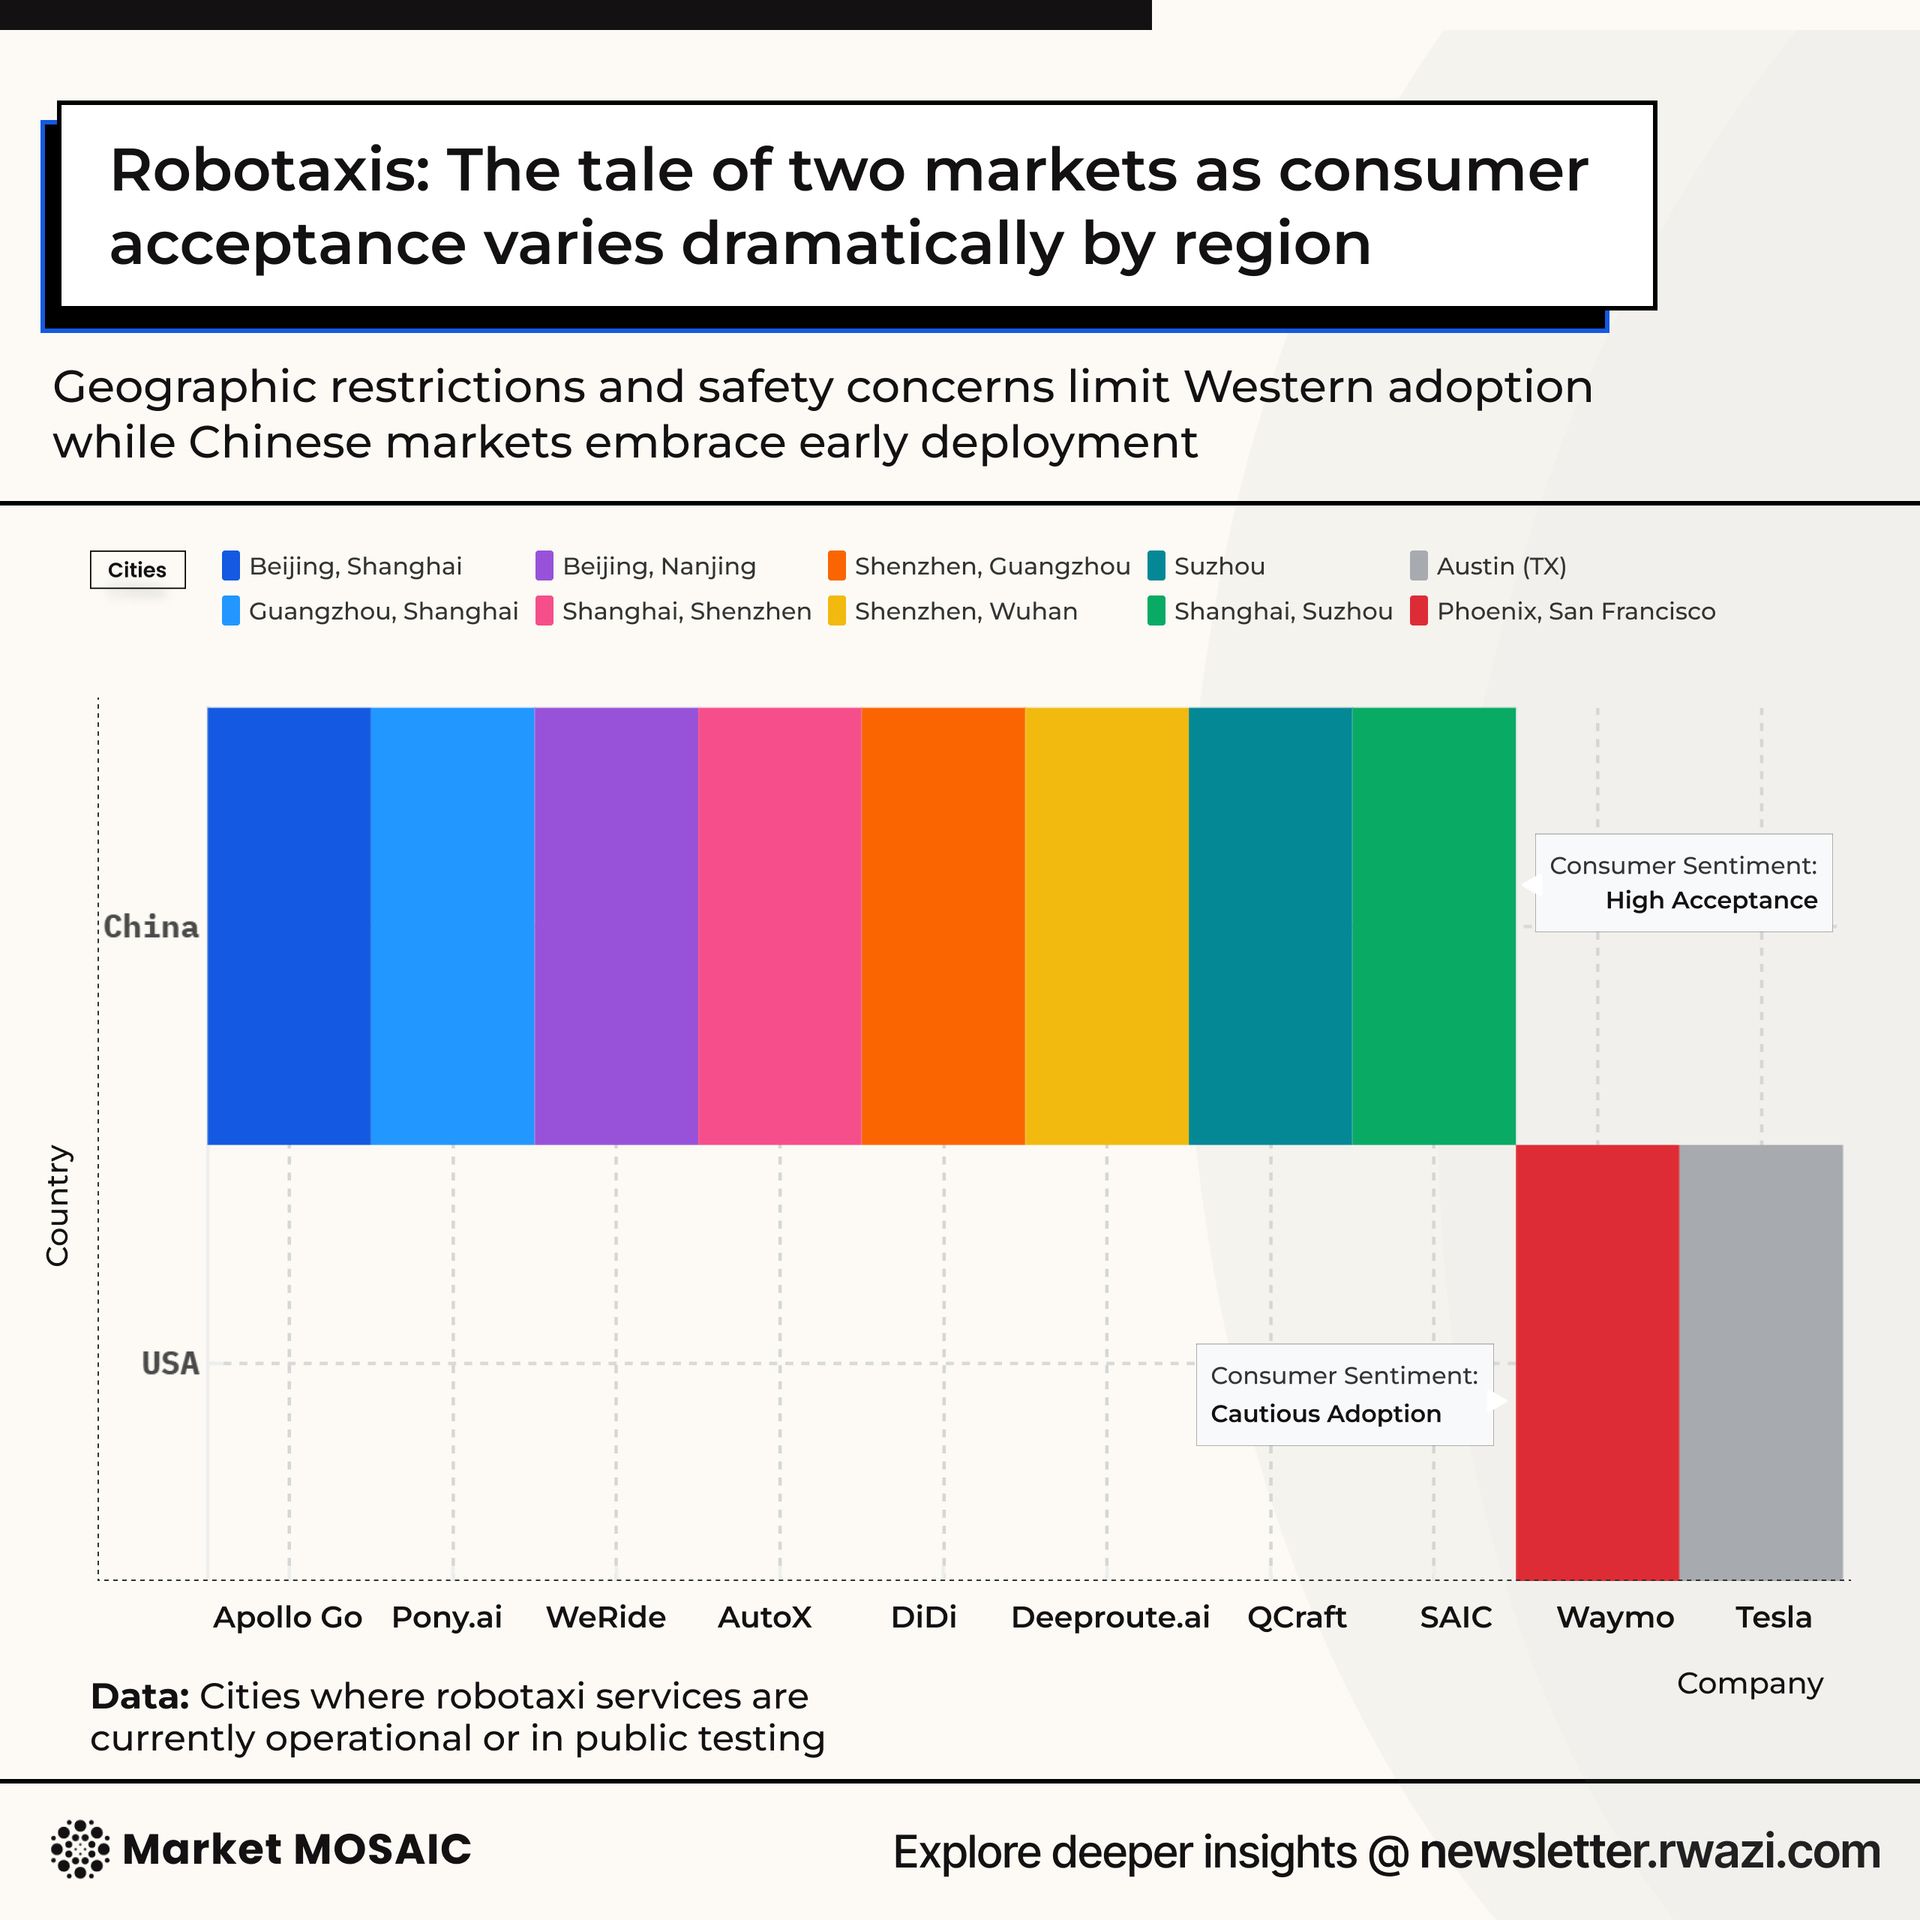
Supply Chain
Our data analysis shows that China has emerged as the undisputed leader in robotaxi development and deployment, with companies like Apollo, WeRide, and Pony.ai operating across 25+ major cities compared to Waymo's 5-city presence in the US. Consumer sentiment data shows remarkable acceptance of…
 ChartEdition #76
Why global businesses bet $648B on this one consumer trend
 ChartEdition #76
Supply Chain
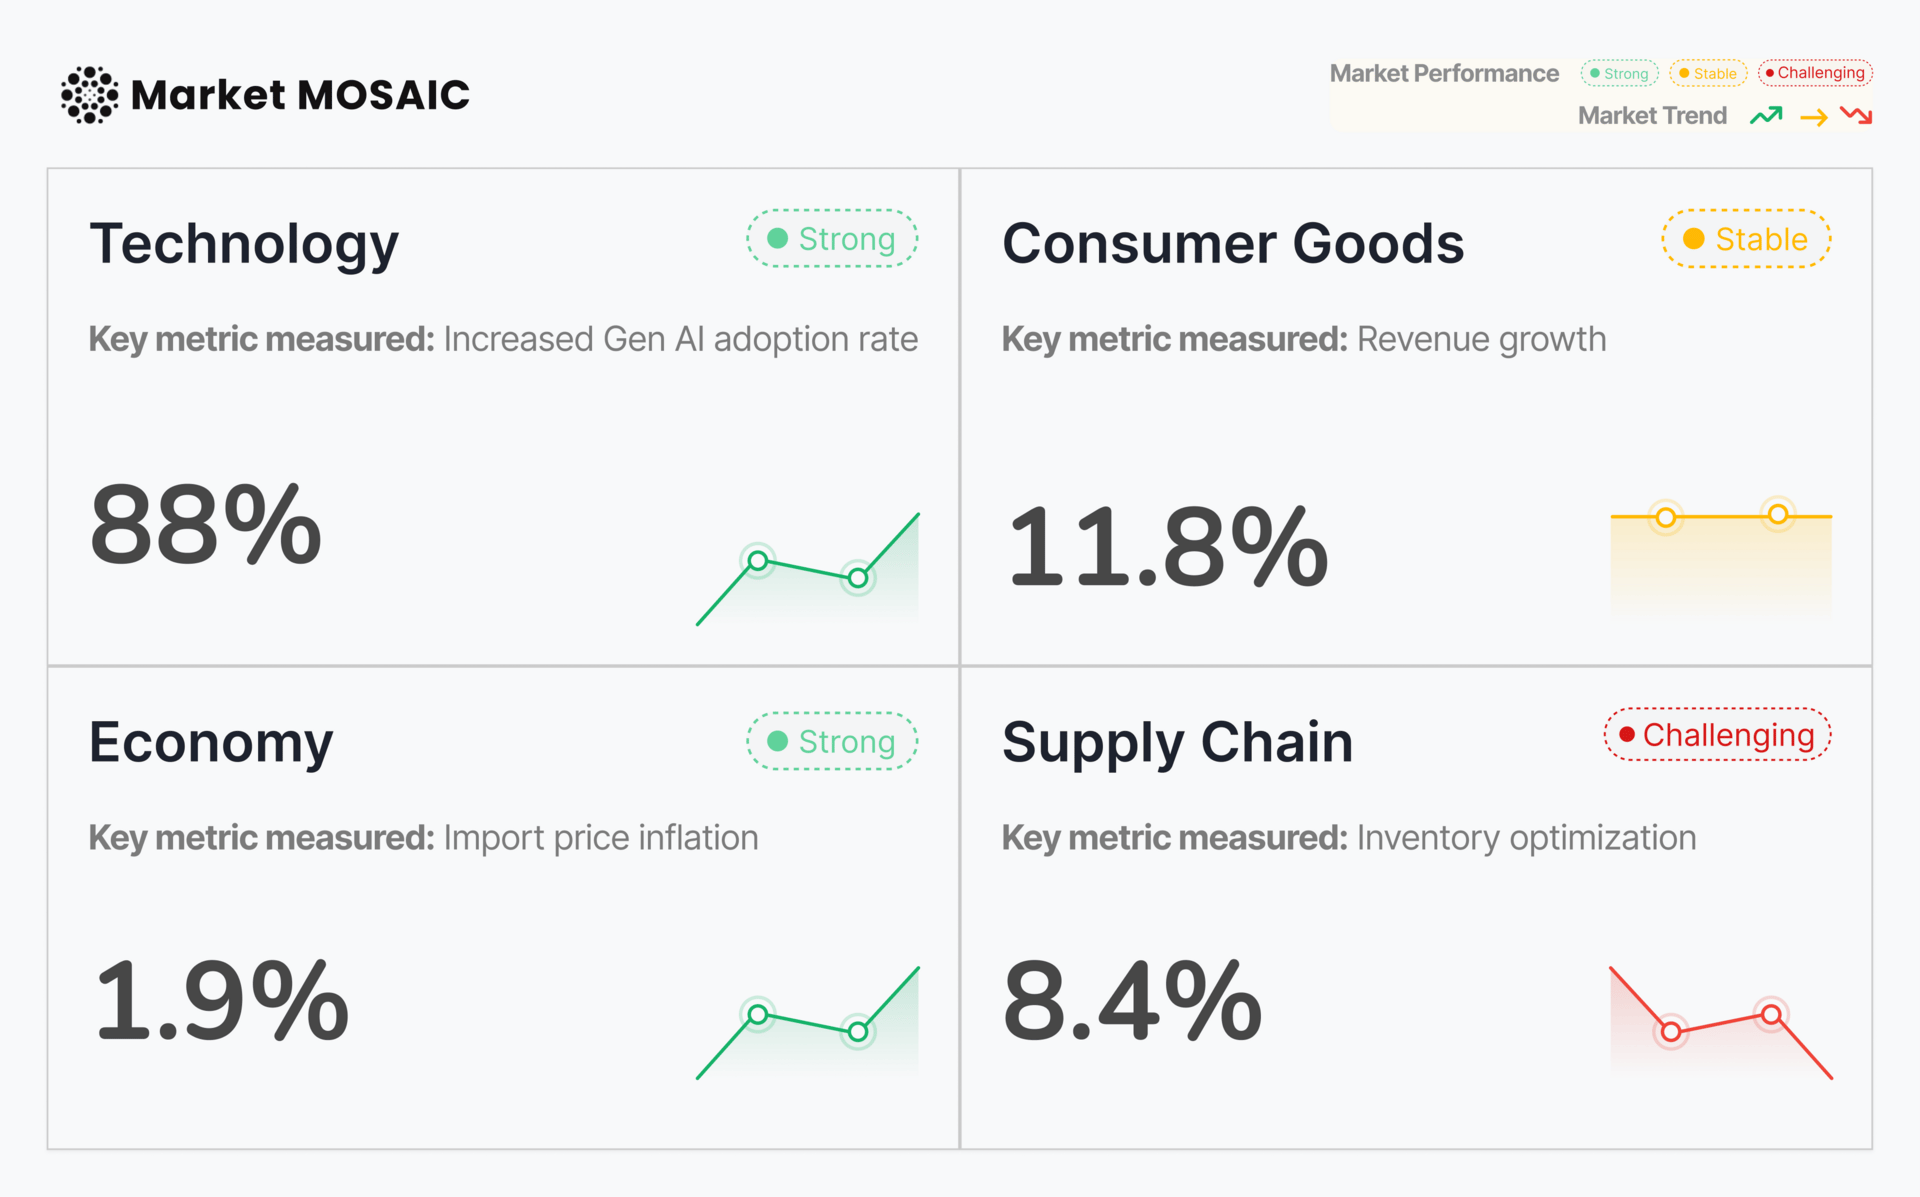
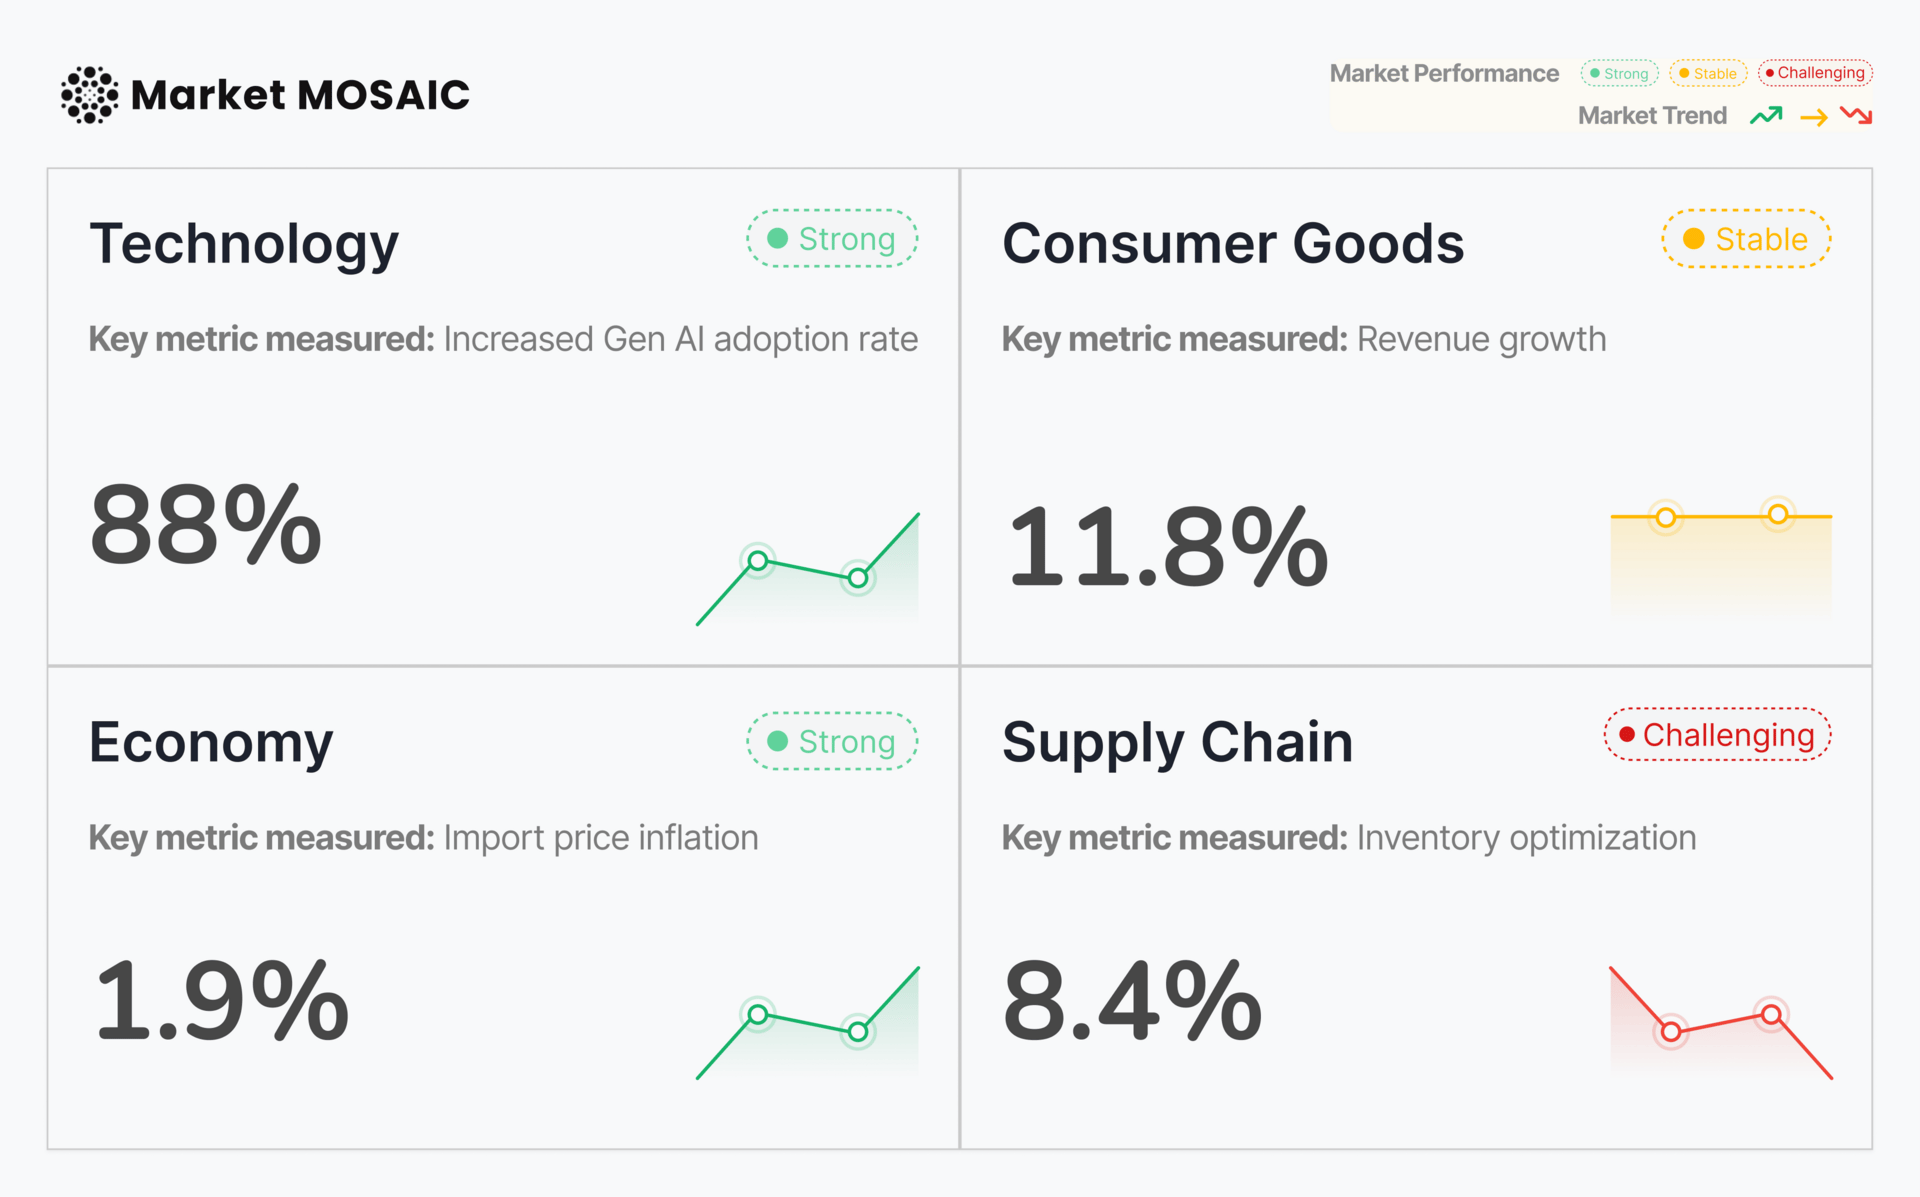
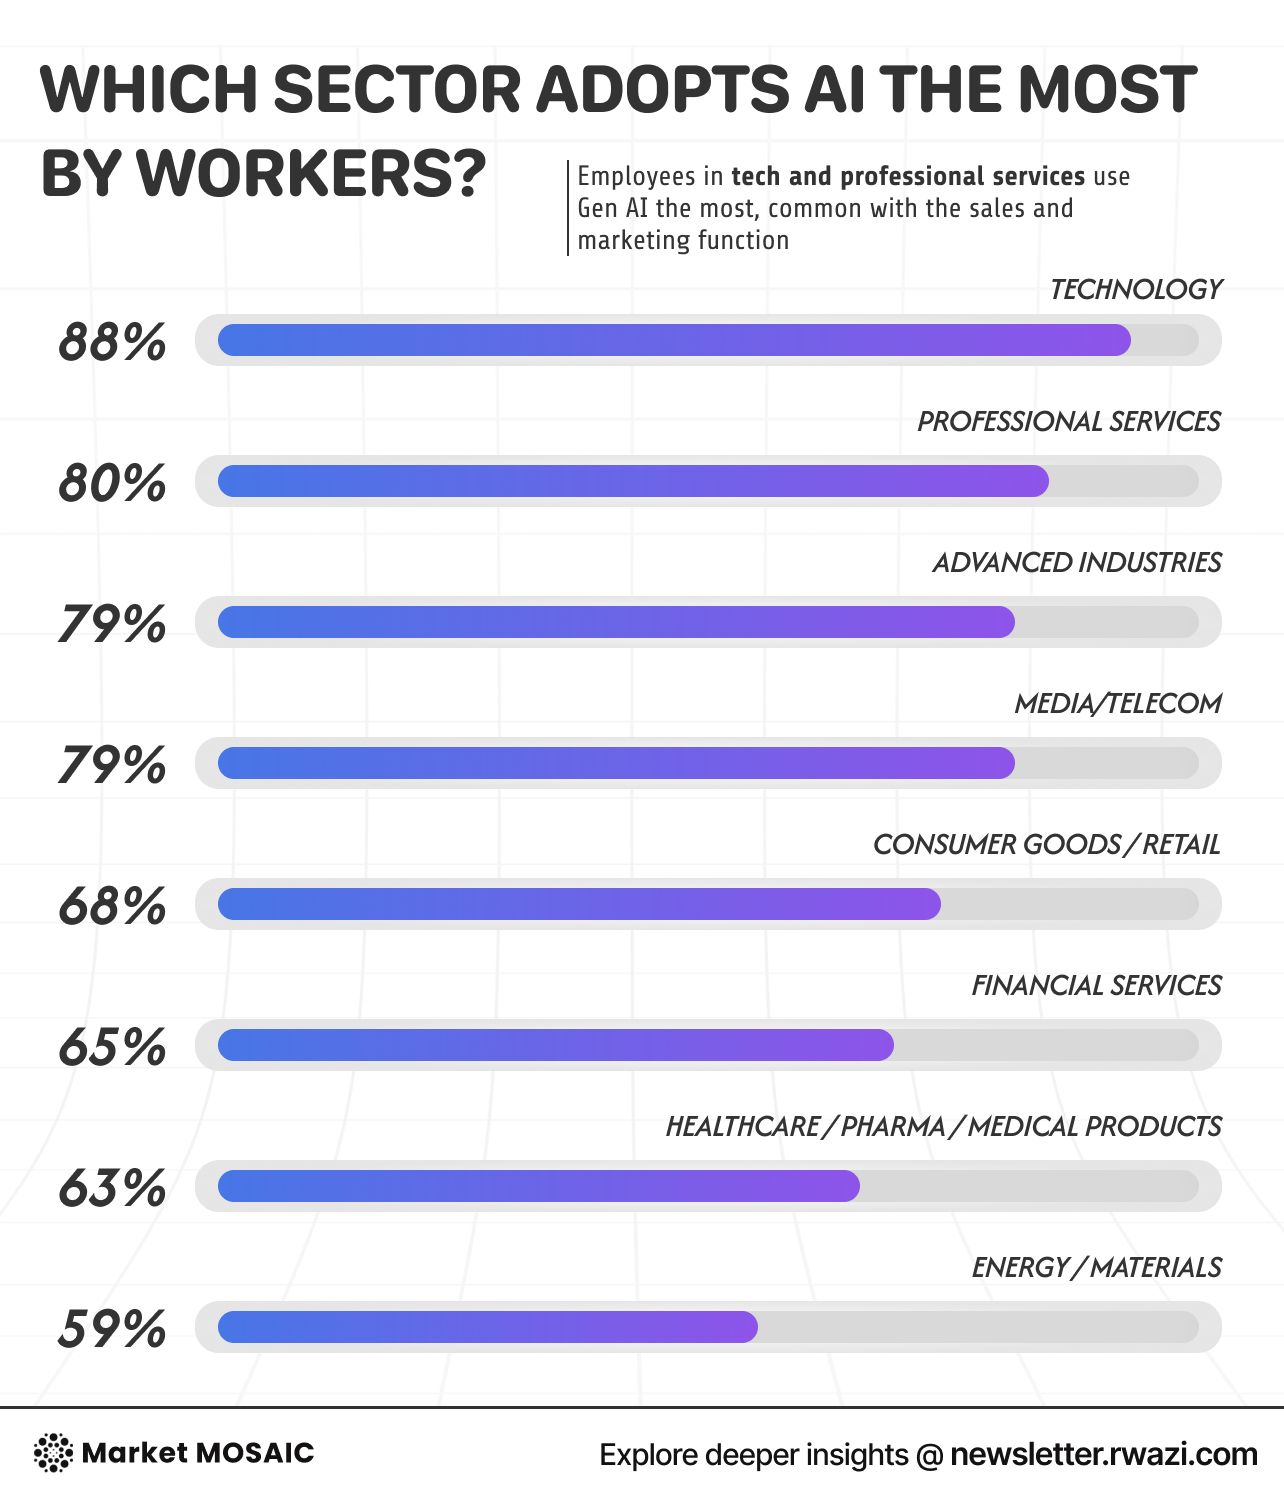
Our data analysis shows that 71% of employees across 11 major industries are now using generative AI for at least one function, a significant jump from 65% in the previous year. The technology sector leads this transformation, with 88% of employees utilising AI tools, followed closely by…
 ChartEdition #75
Supply Chain
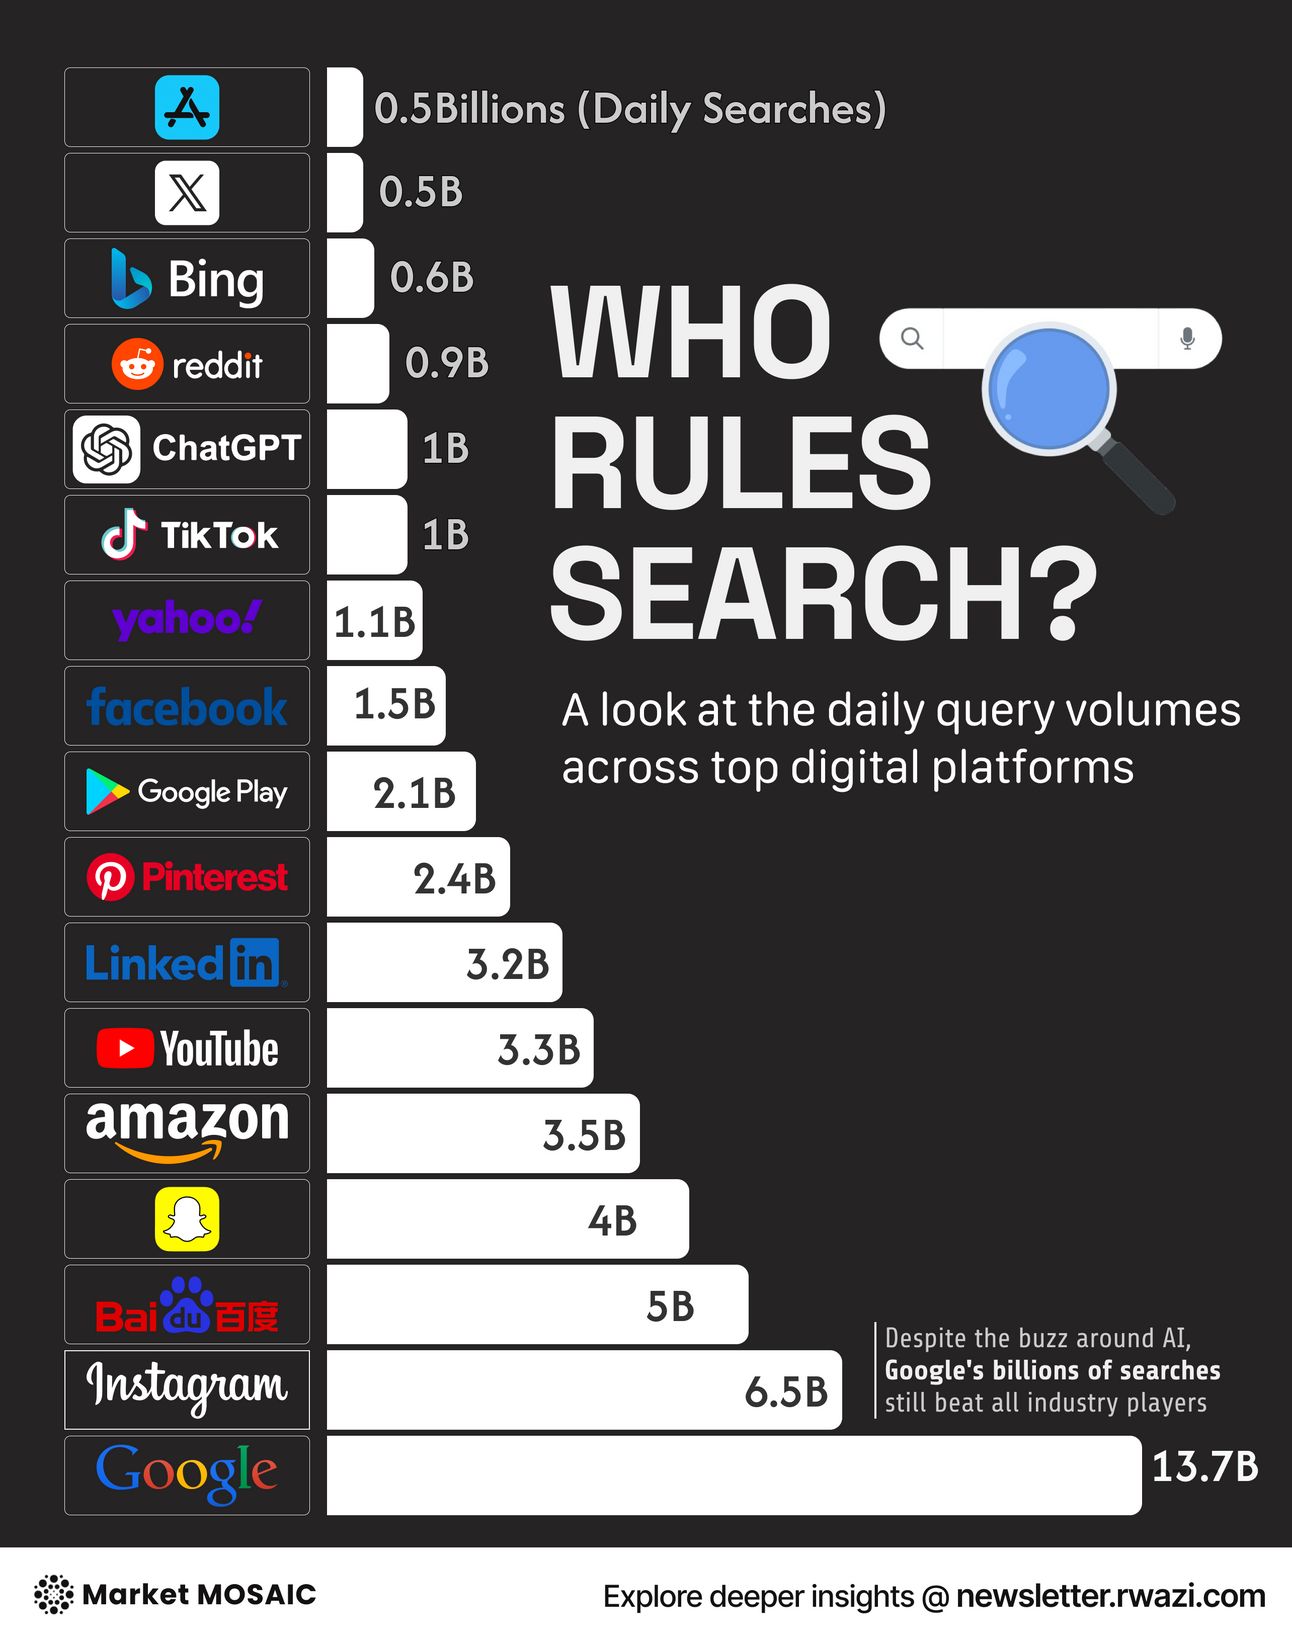
Despite the AI buzz, traditional search platforms continue to dominate consumer information-seeking behavior. ChatGPT's impressive 1 billion daily searches still places it far behind established platforms, revealing crucial insights about how consumers actually discover and consume information.…
 Sector trackerEdition #75
Sector Performance Tracker
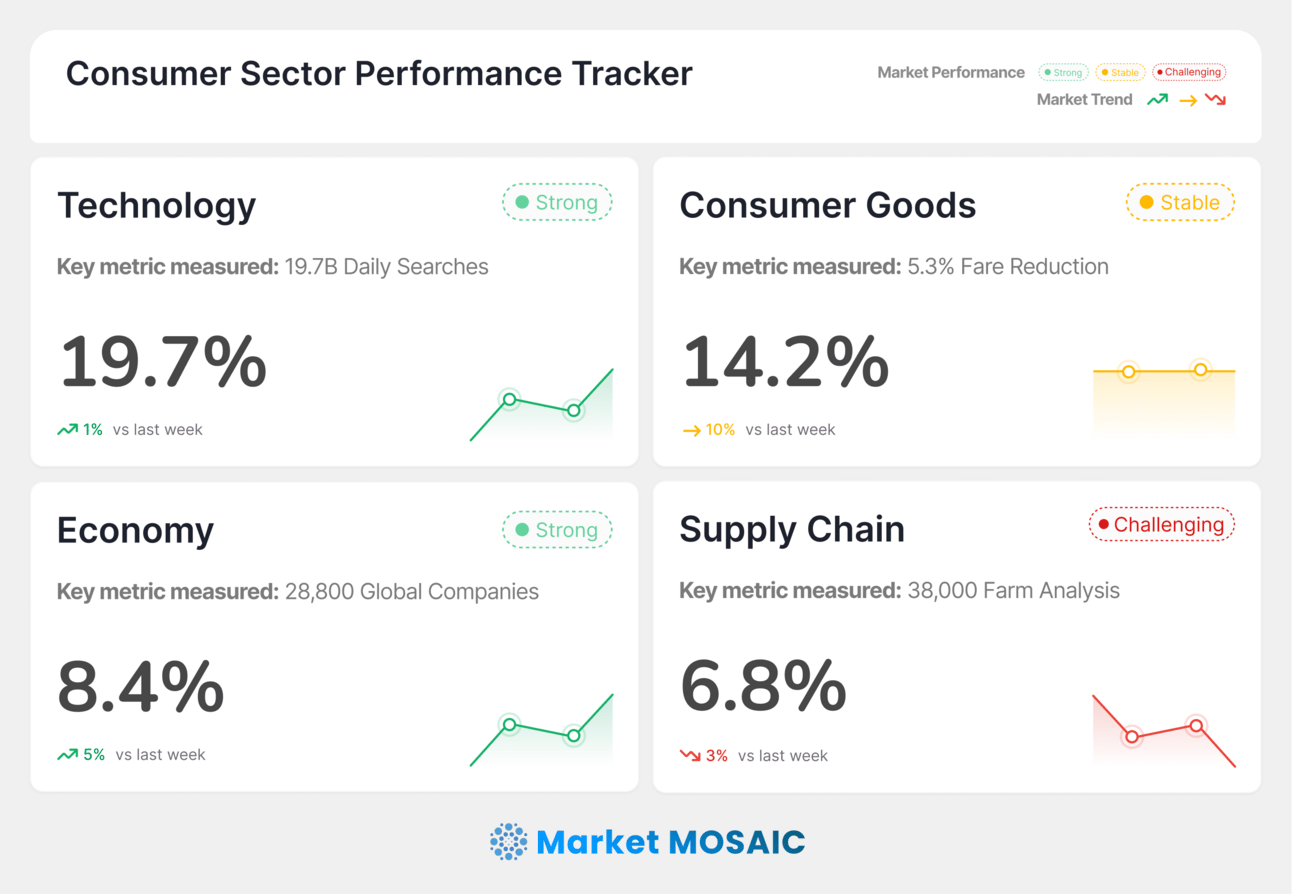
This weekly global market performance snapshot was analysed by Rwazi Insights
 ChartEdition #74
Supply Chain
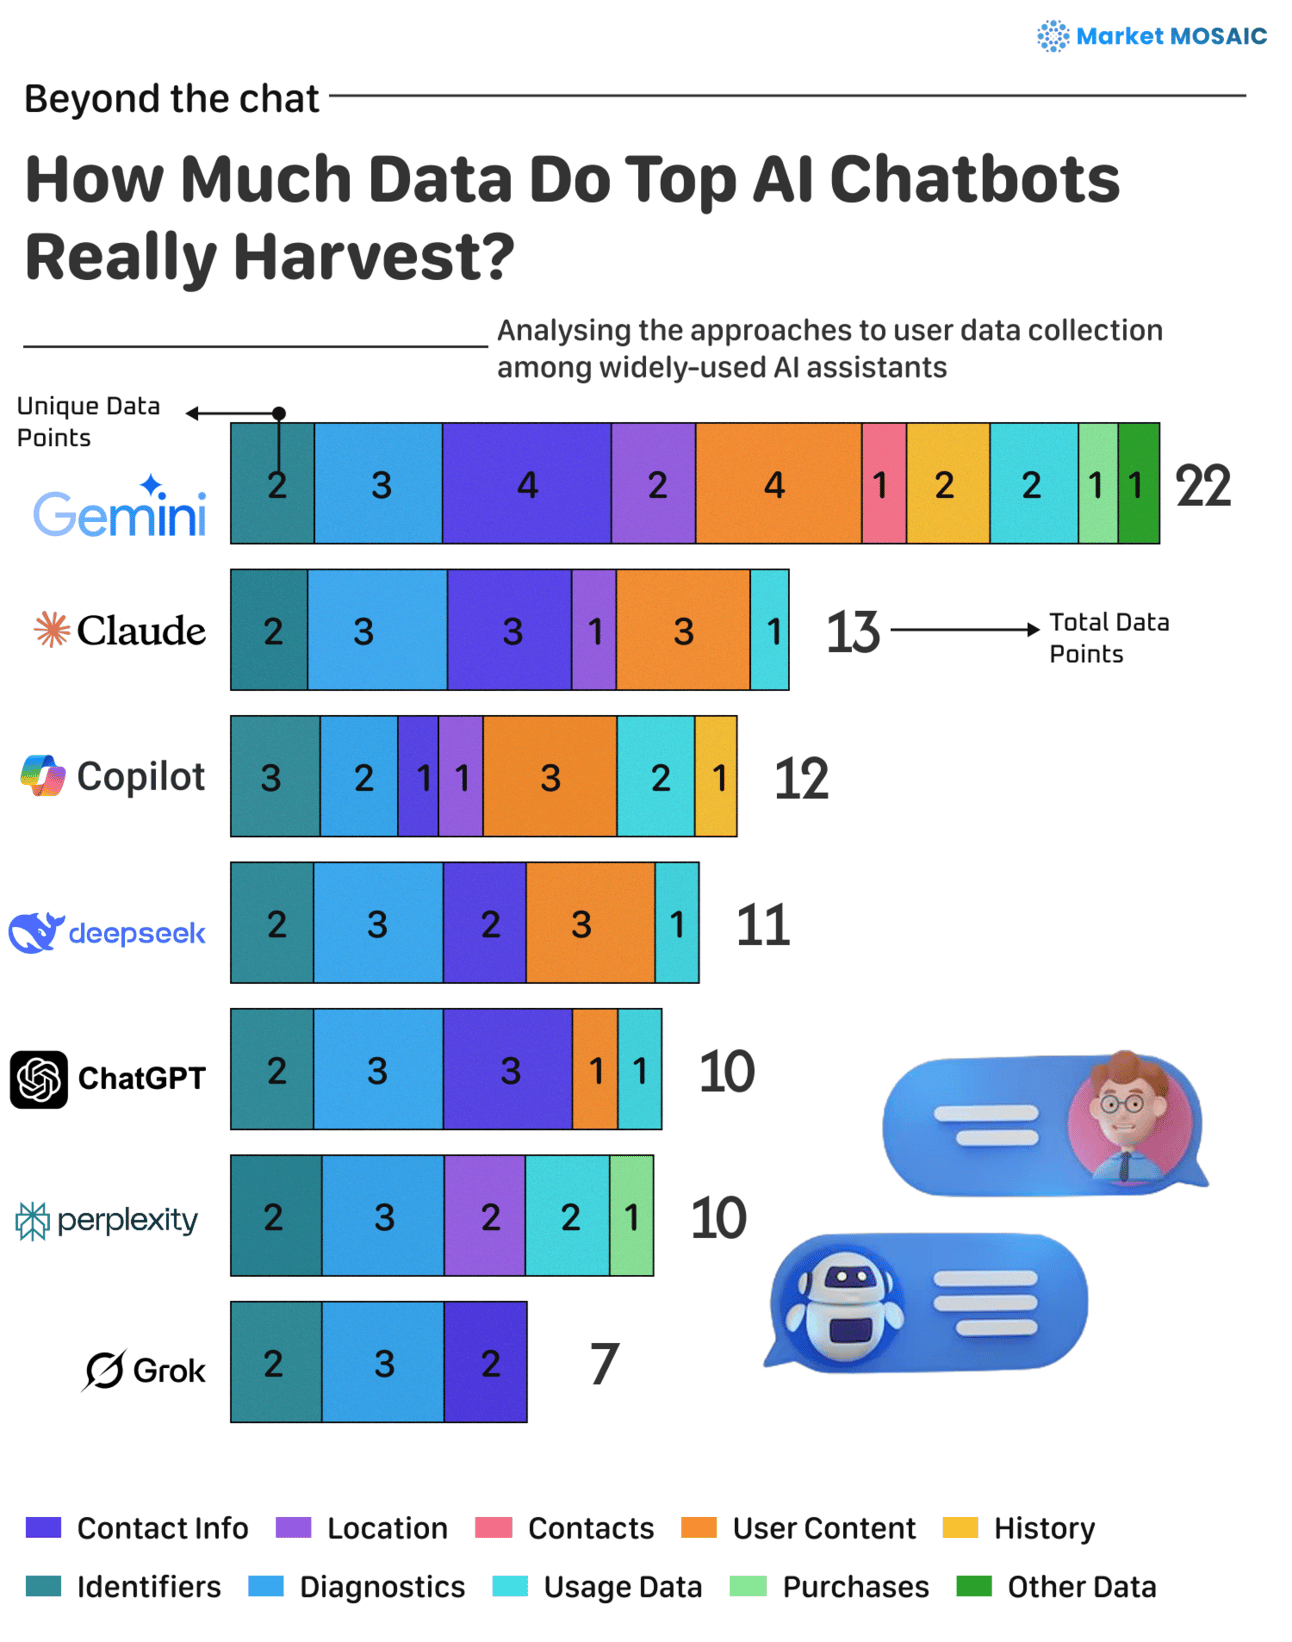
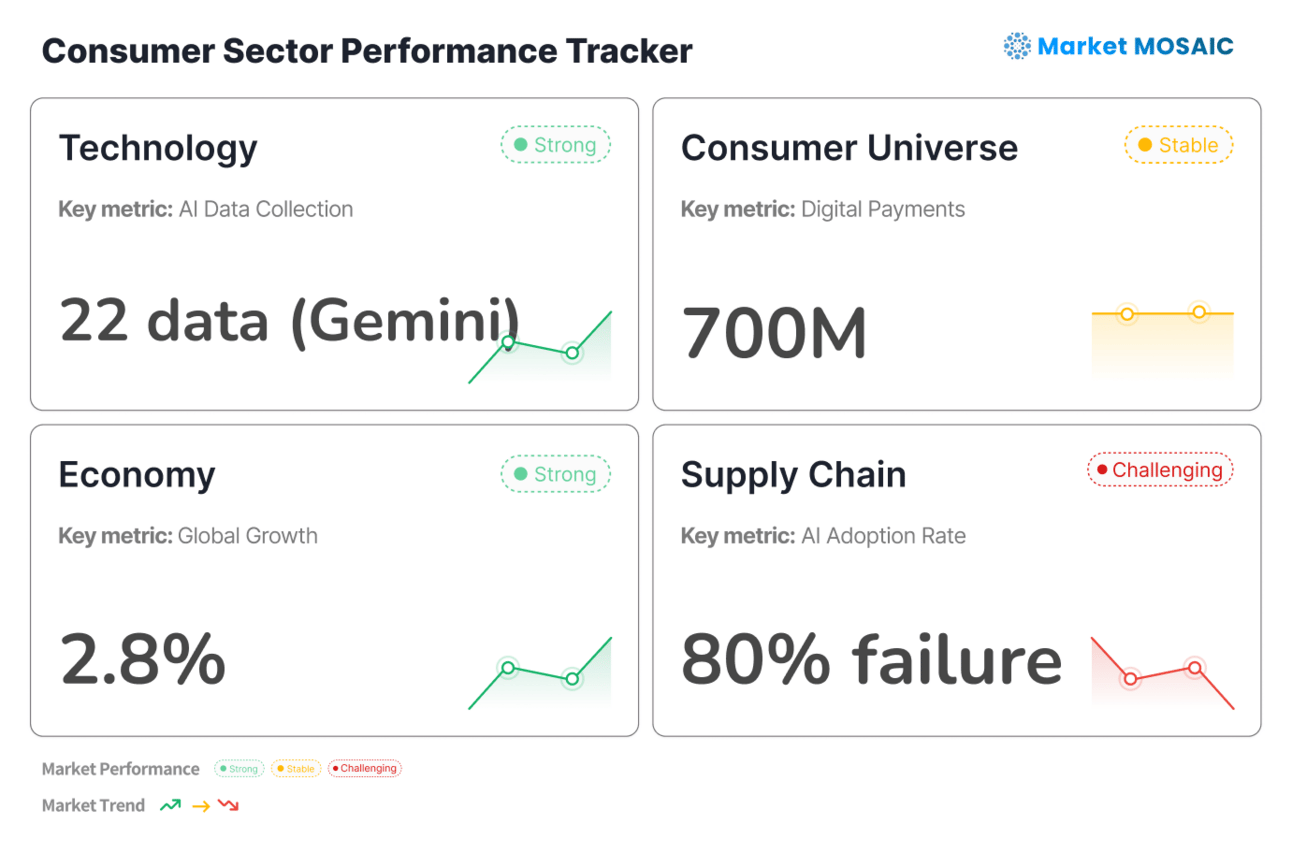
Our analysis reveals a striking disparity in data collection practices among major AI chatbots, with Google's Gemini collecting 22 different data points compared to xAI's Grok at just 7. This variance comes at a critical time when consumer awareness about data privacy has reached unprecedented…
 Sector trackerEdition #74
Sector Performance Tracker
This weekly global market performance snapshot was analysed by Rwazi Insighta
 ChartEdition #73
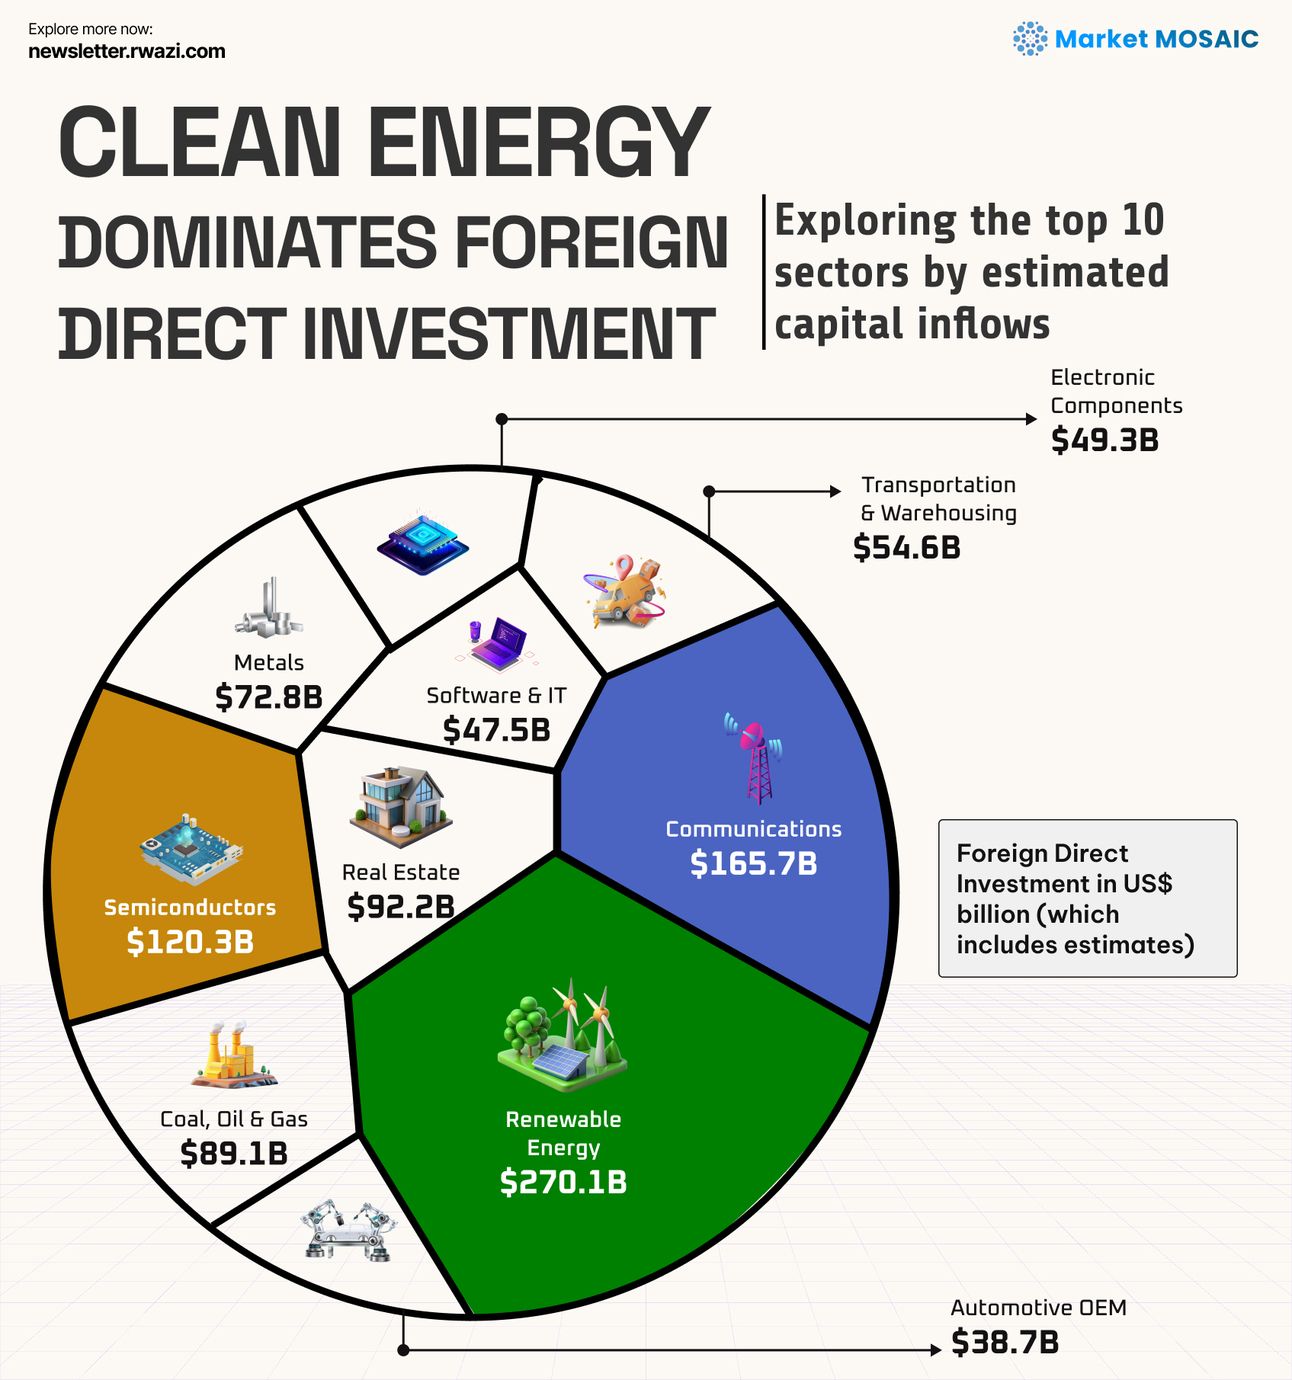
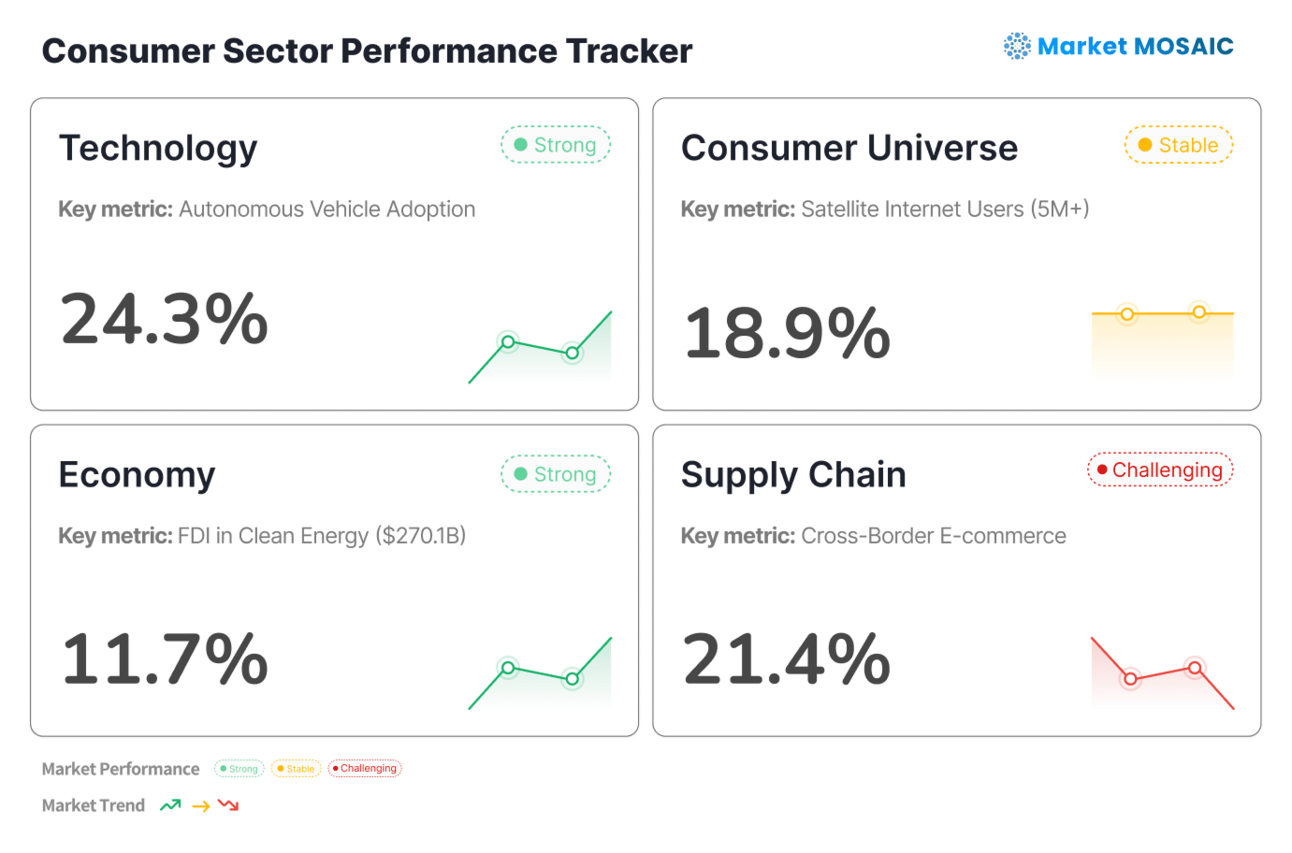
11,600 satellites, $270B in clean energy, but 350M still can't get online
Data analysis by Market Mosaic has shown that global Foreign Direct Investment (FDI) now has a strategic shift toward long-term structural sectors, with renewable energy maintaining its dominance by attracting $270.1 billion and retaining the top position for six consecutive years despite a decline…
 Sector trackerEdition #73
Sector Performance Tracker
This weekly global market performance snapshot was analysed by Rwazi Insights
 ChartEdition #72
Supply Chain
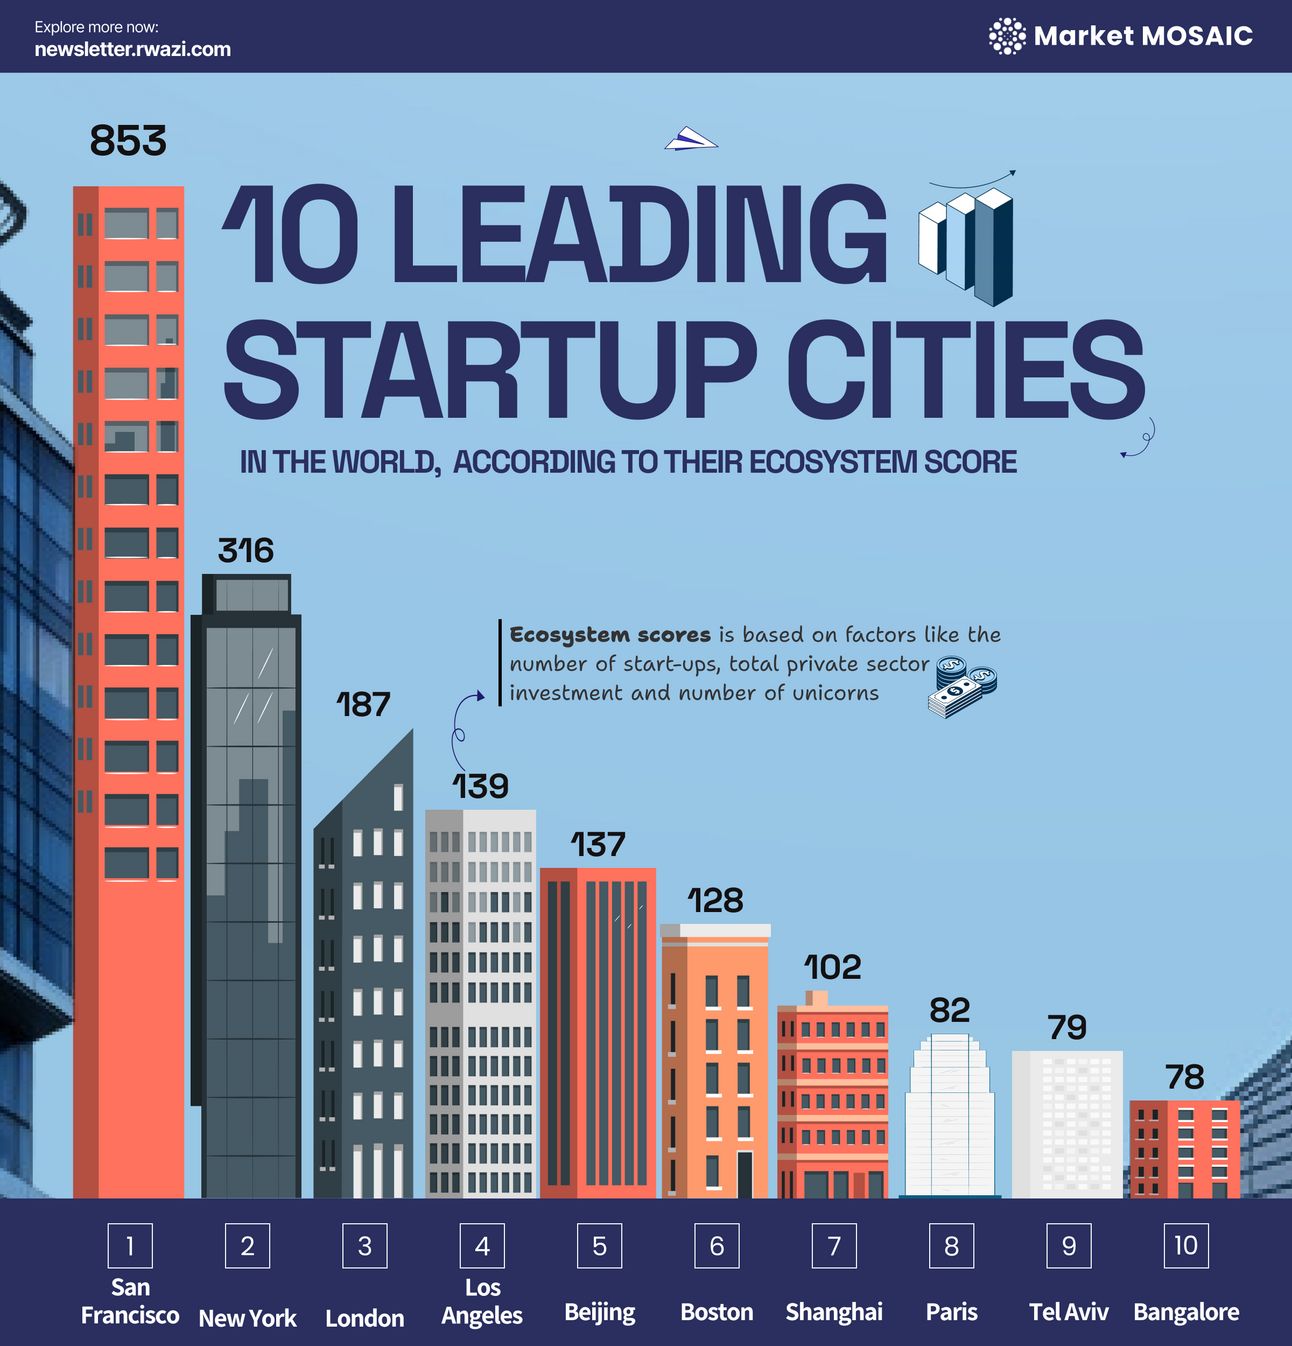
While San Francisco Bay Area maintains its position as the world's leading startup ecosystem with an Index score of 853, our analysis shows that Asian markets are gaining prominence. Singapore's remarkable four-spot jump in global rankings now shows a shift in how multinational tech companies view…
 ChartEdition #71
Supply Chain
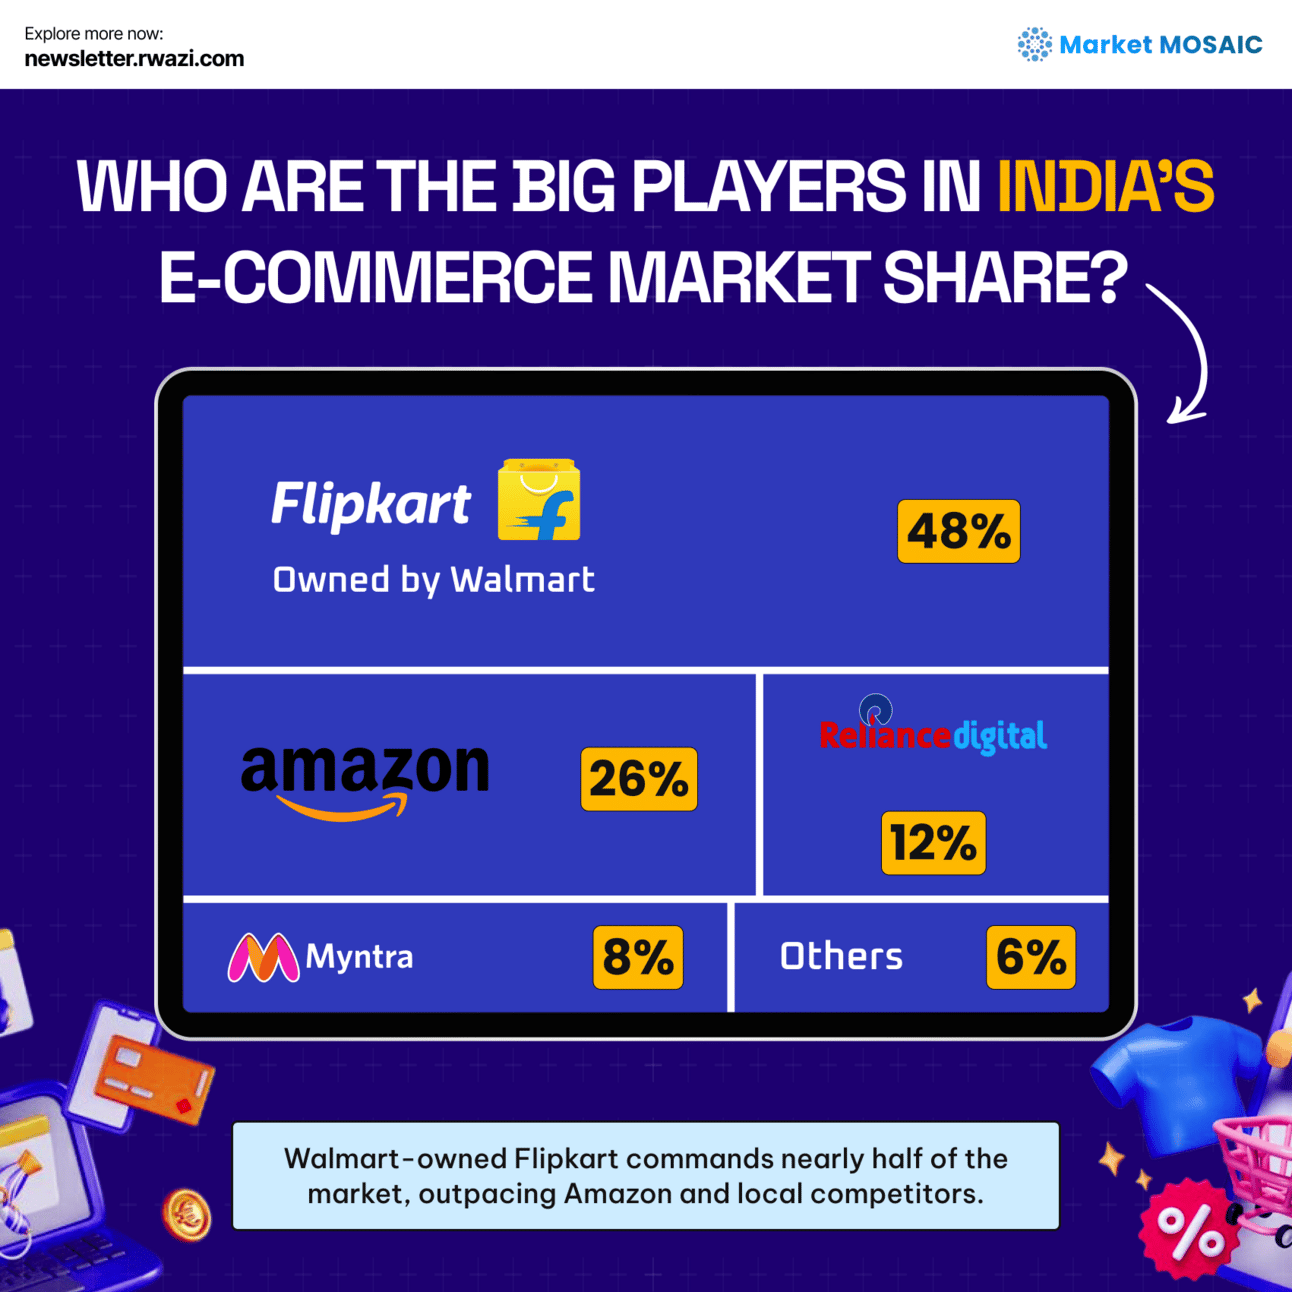
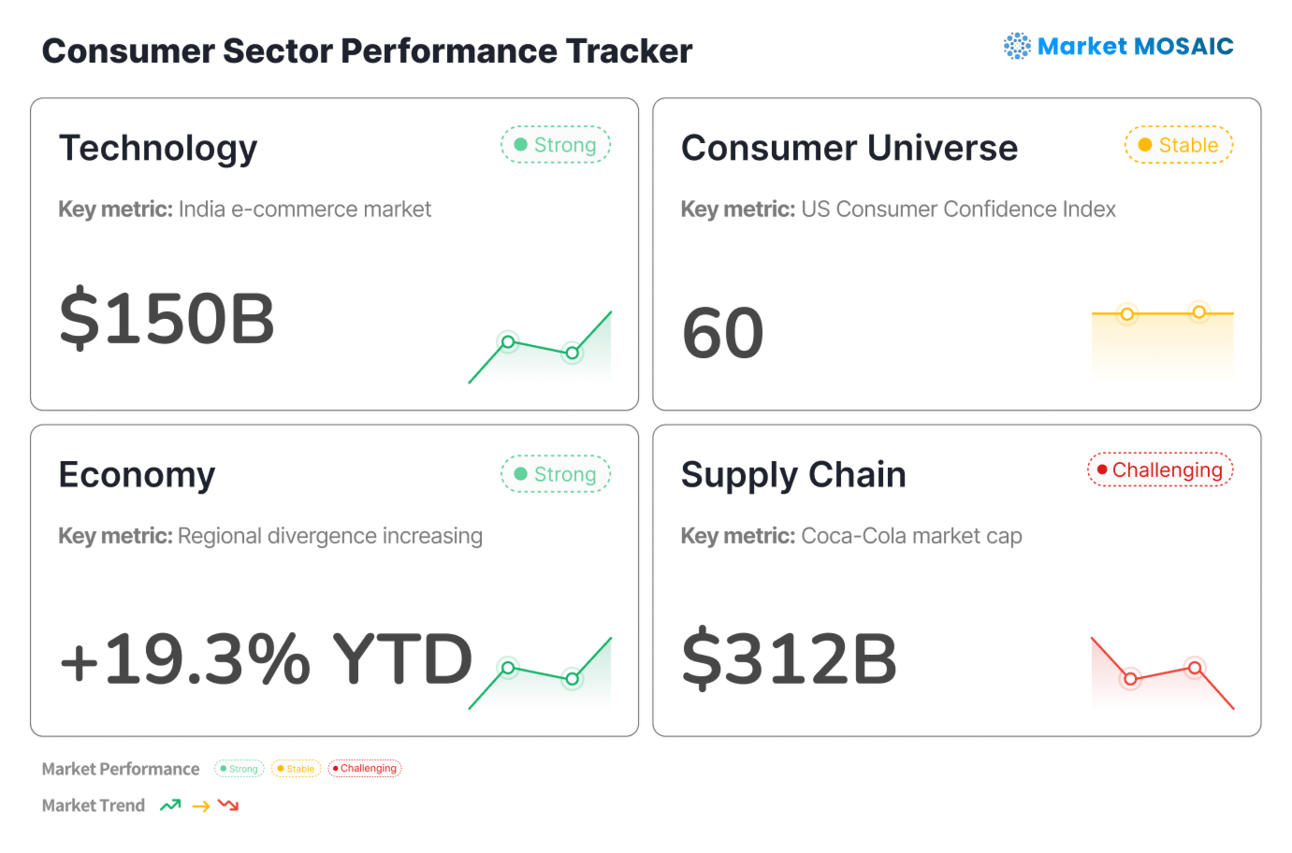
India's digital transformation is creating unprecedented opportunities for consumer engagement and market expansion. With the e-commerce sector projected to surpass $150 billion in 2024, we are observing a major shift in how Indian consumers discover, evaluate, and purchase products. Our analysis…
 Sector trackerEdition #71
Sector Performance Tracker
This weekly global market performance snapshot was analysed by Rwazi Insights
 ChartEdition #70
Supply Chain
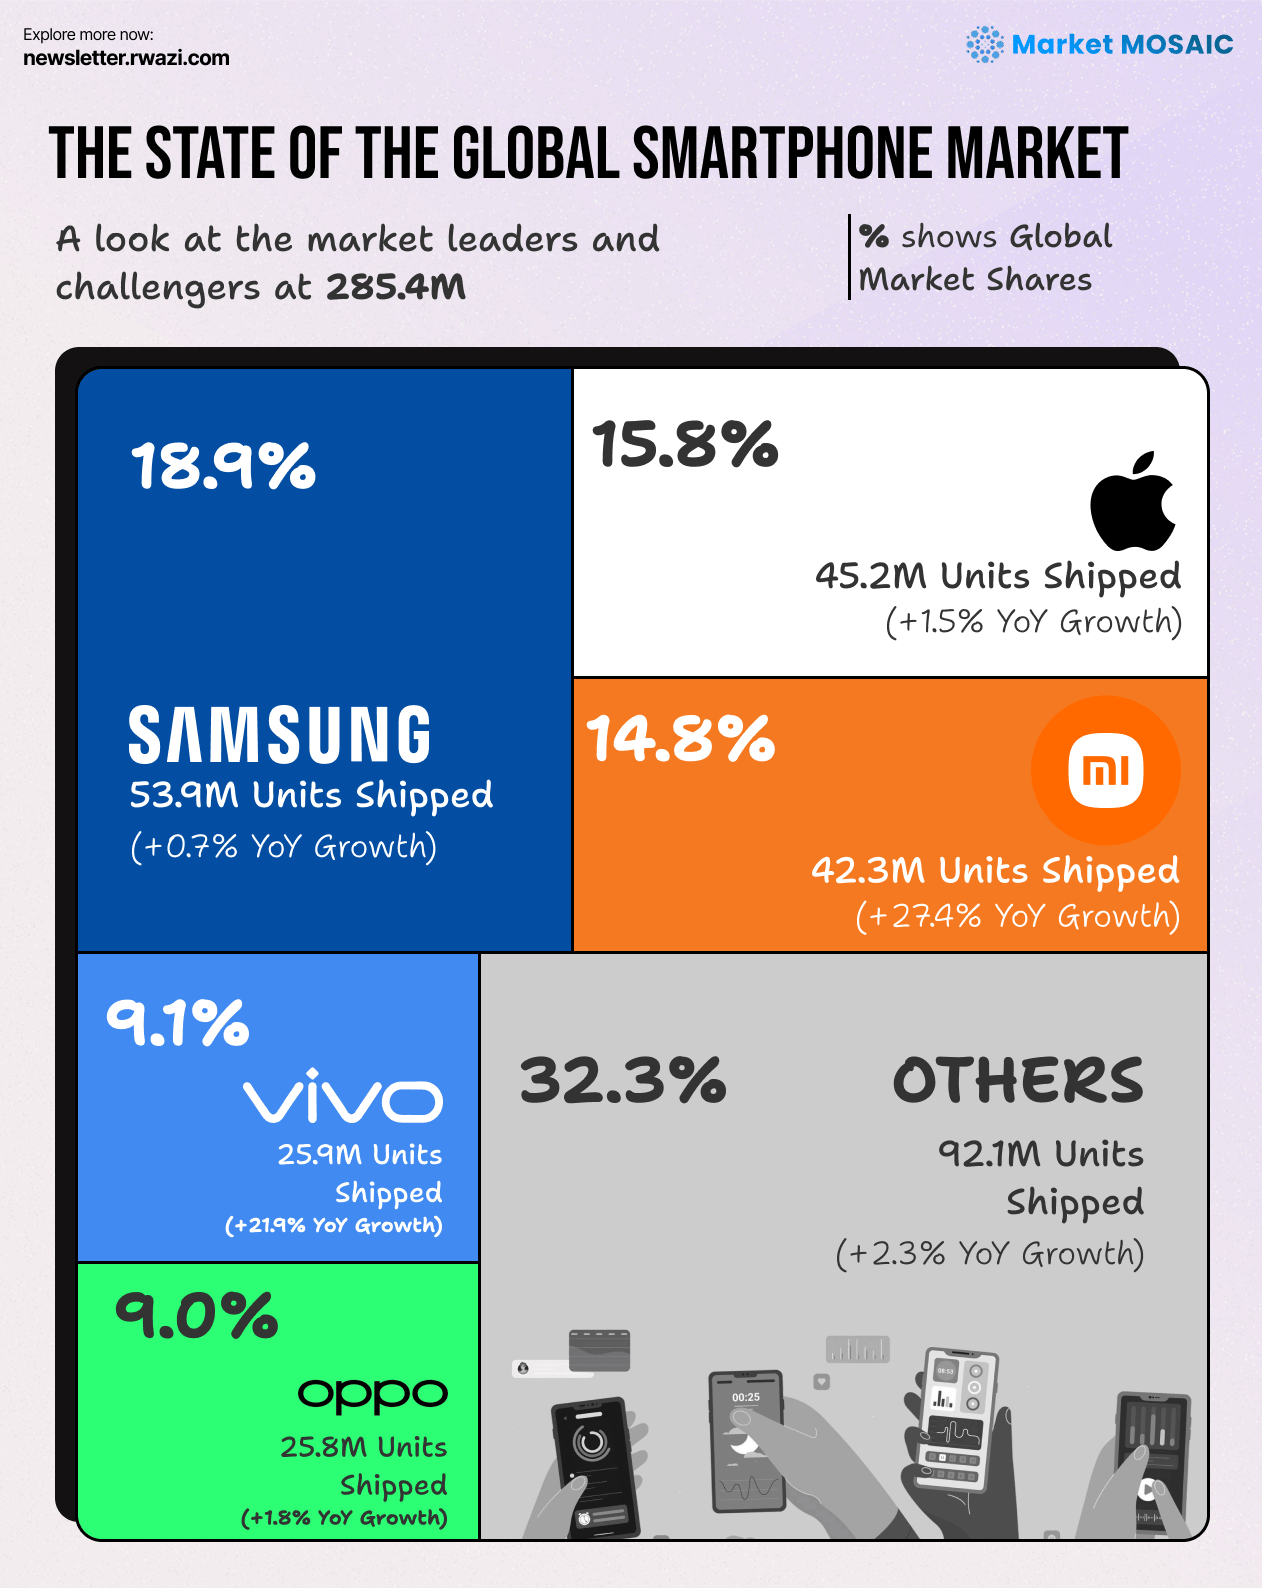
The global smartphone market shows fascinating consumer behavior patterns that extend far beyond device preferences. Samsung maintains its global dominance with 18.9% market share across 38 countries, but the real story lies in the dramatic surge of Chinese manufacturers challenging established…
 Sector trackerEdition #70
Sector Performance Tracker
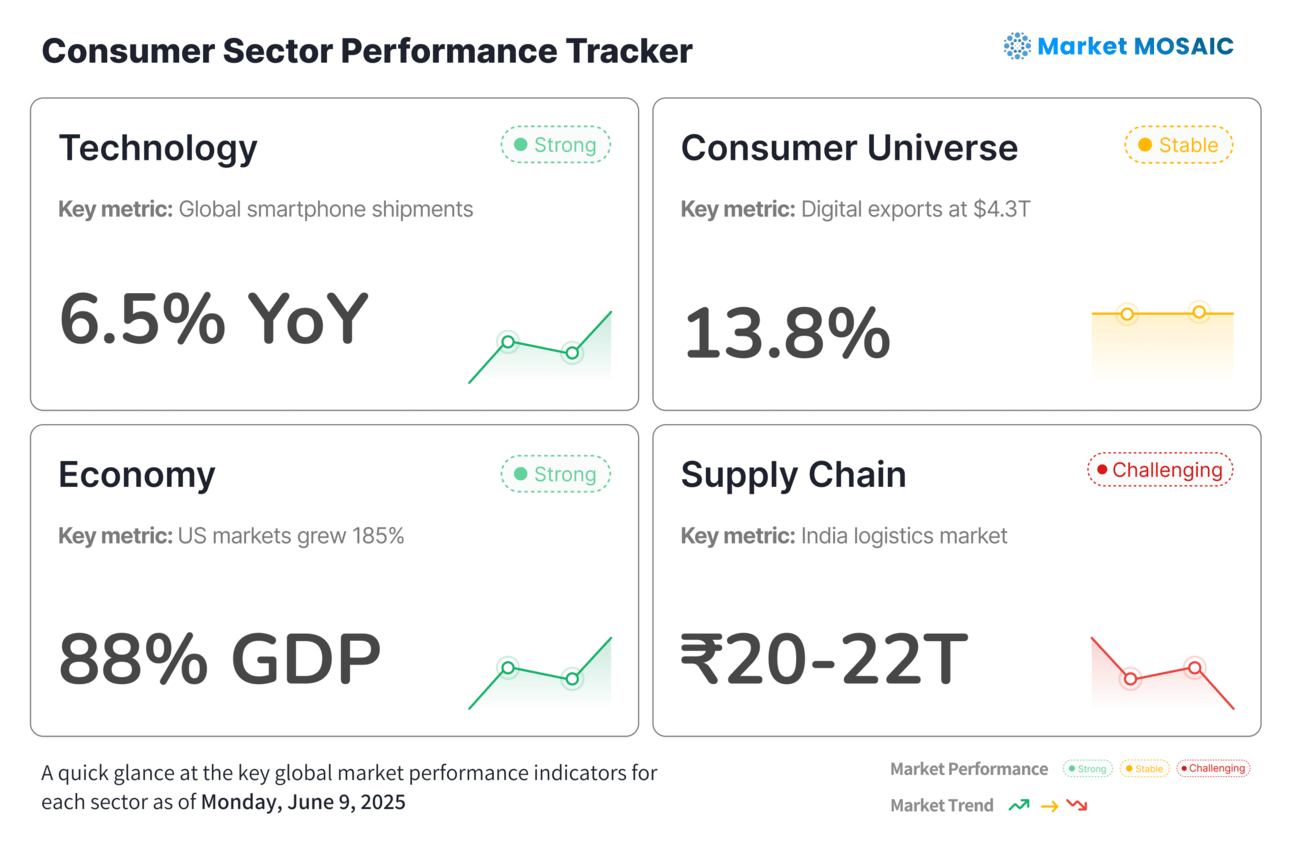
This weekly market snapshot was compiled and analysed by Rwazi Insights
 ChartEdition #69
Supply Chain
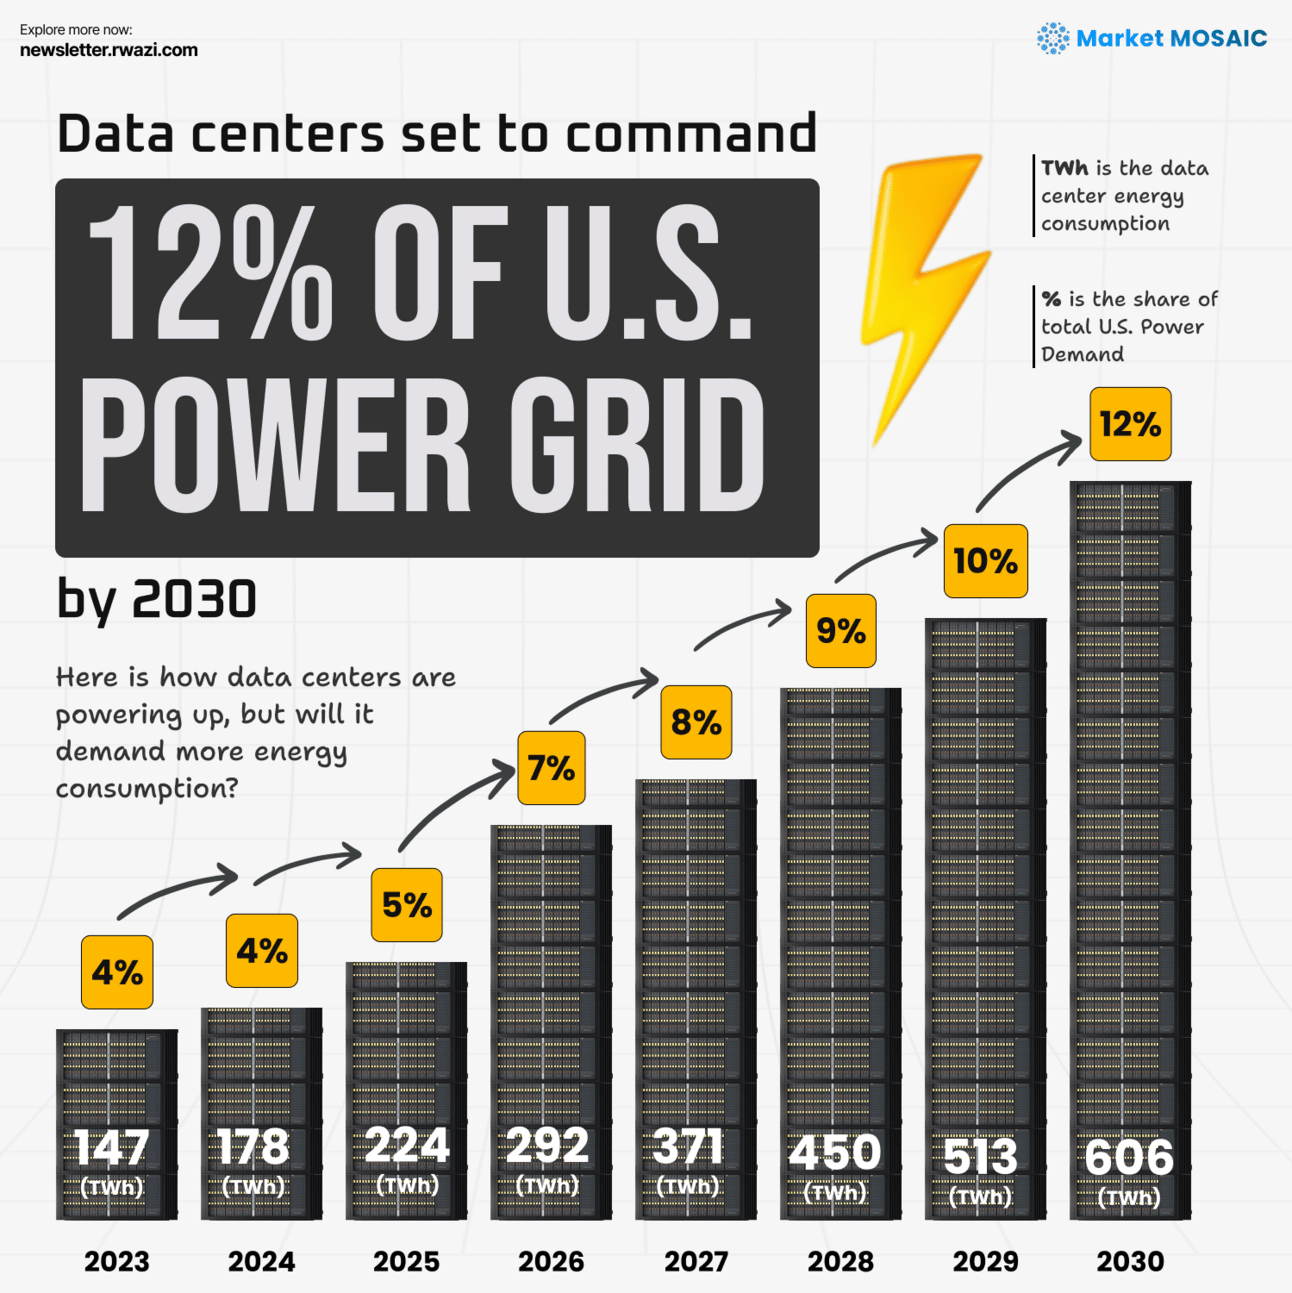
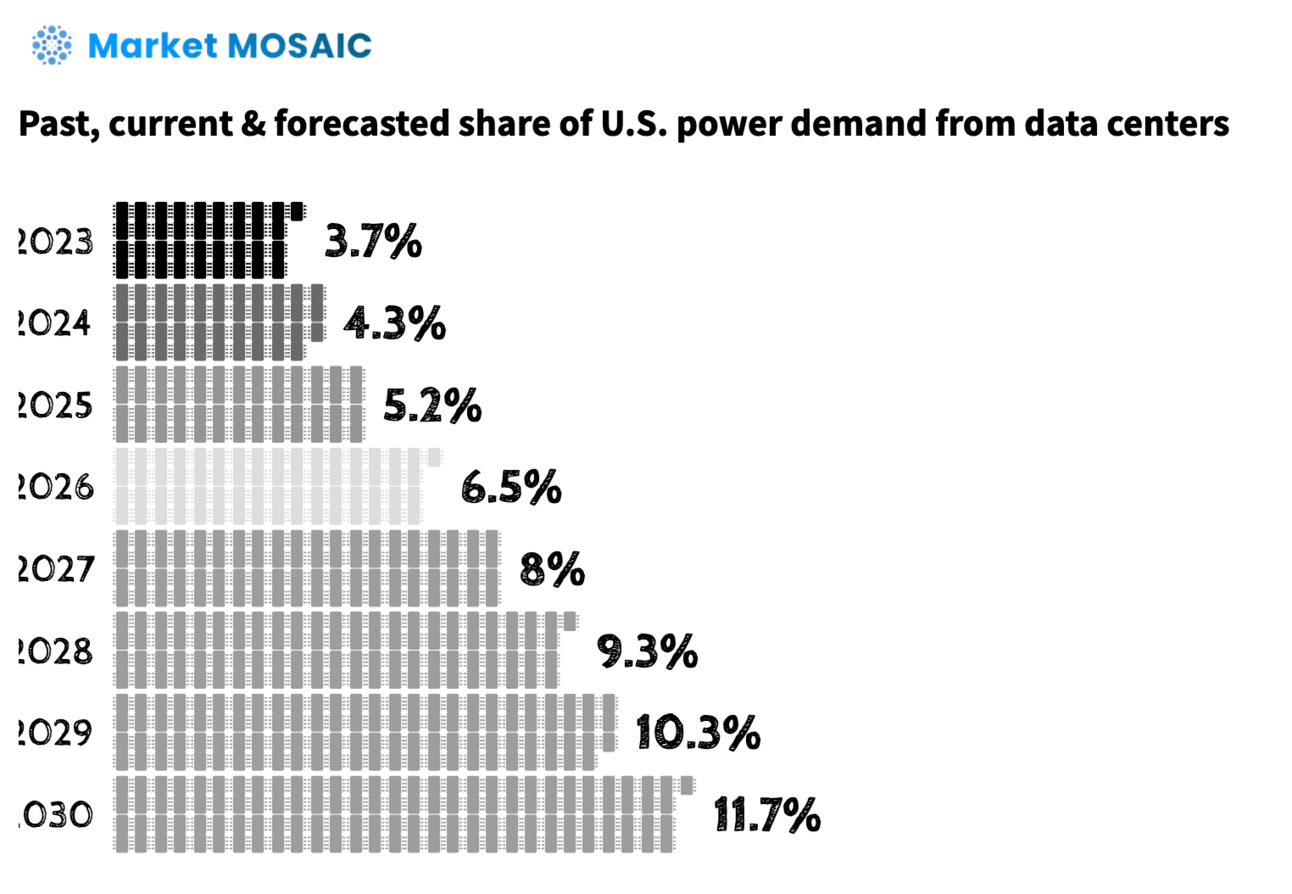
The digital transformation driving consumer experiences comes with a massive hidden cost: energy consumption. And according to analysis by Market Mosaic, data centres in the United States will consume 606 terawatt-hours of energy, 12% of the nation's power by 2030, up from just 3% today, equivalent…
 ChartEdition #69
How e-wallets are quietly crushing credit cards
 Sector trackerEdition #69
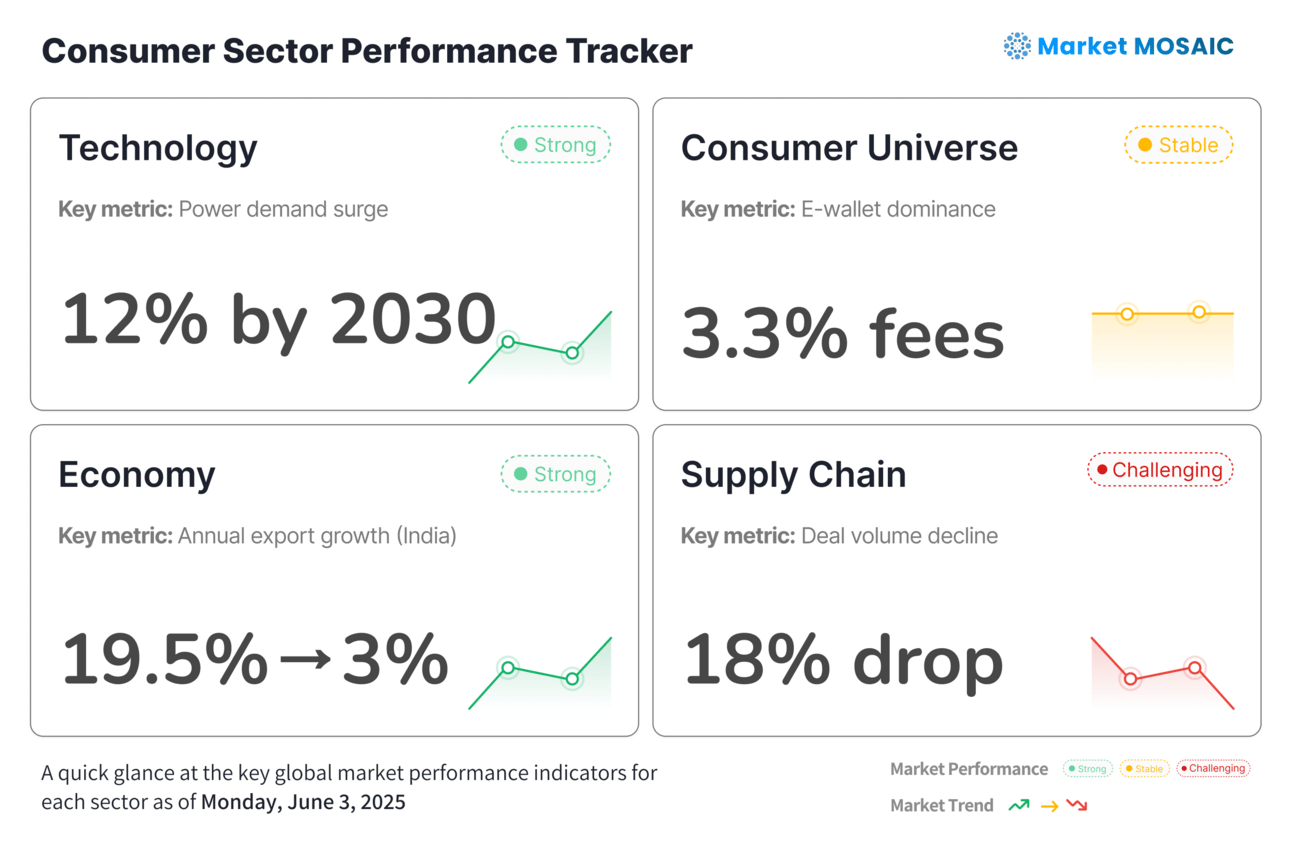
Sector Performance Tracker
This weekly market snapshot was compiled and analysed by Rwazi Insights
 ChartEdition #68
50% price hikes & 66% AI concentration signal massive market shifts ahead
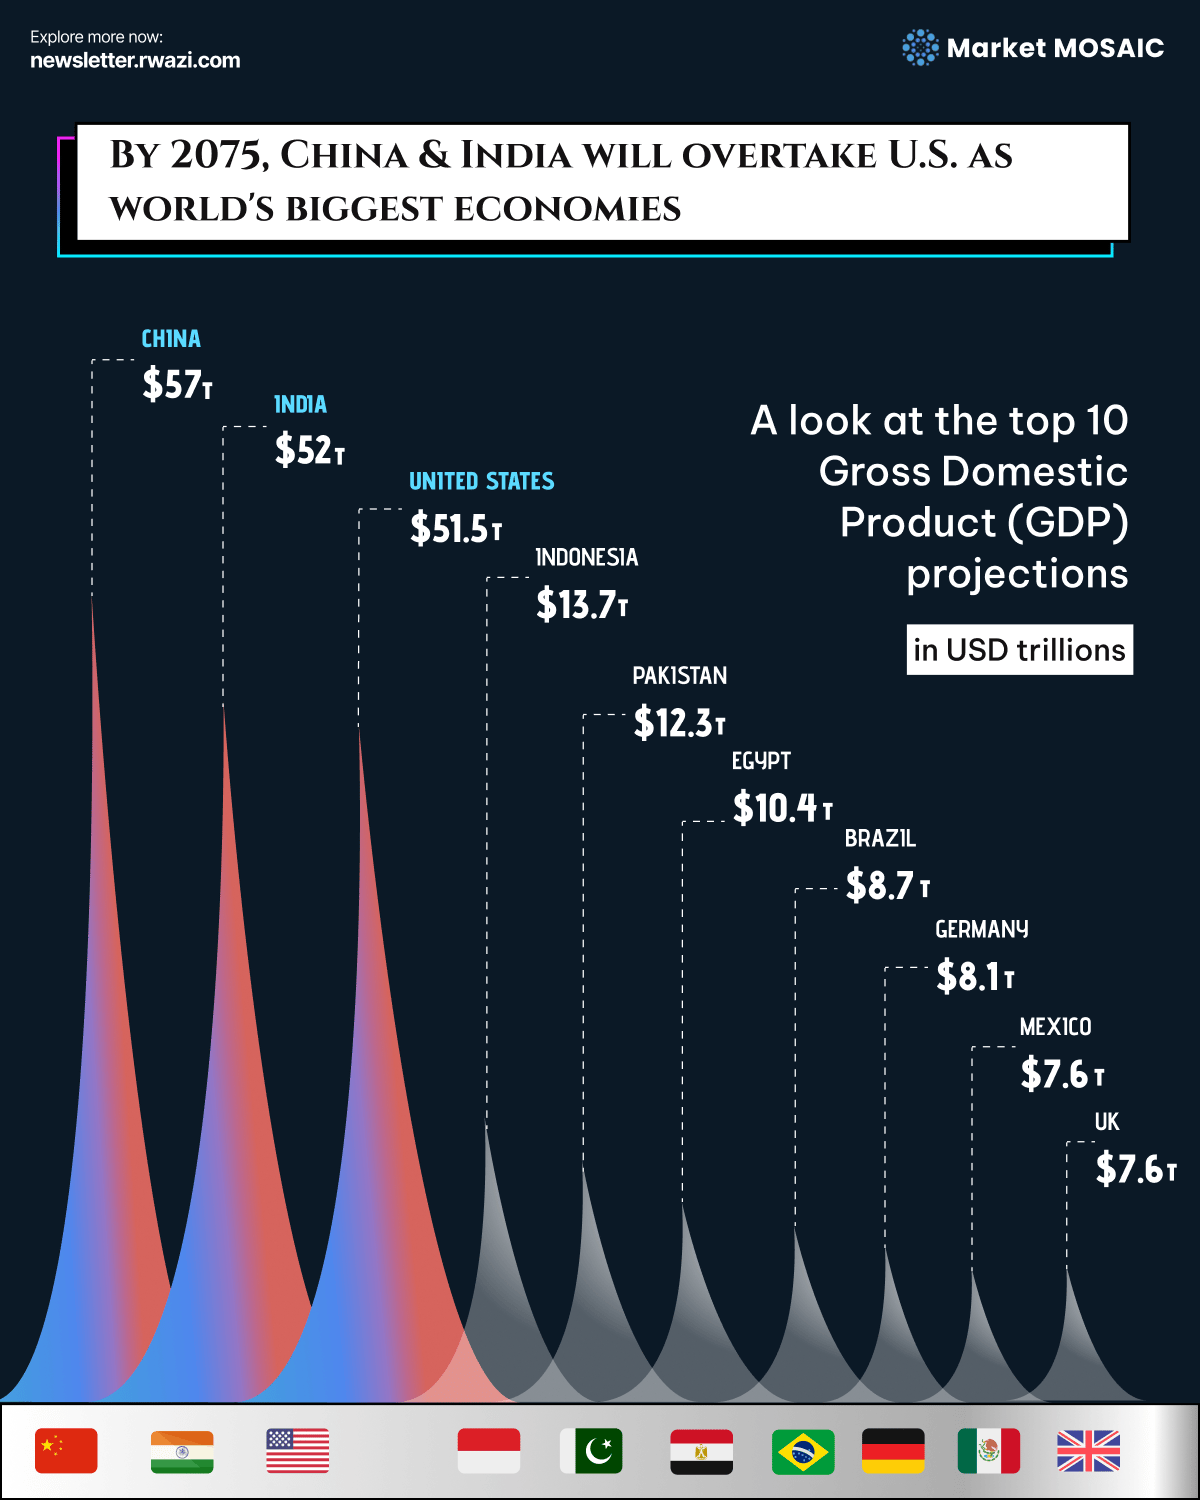
Long-term economic projections reveal a dramatic shift in global purchasing power that will fundamentally alter consumer markets. By 2075 , China is projected to reach $57 trillion in GDP, closely followed by India at $52.5 trillion, while the United States is expected to maintain $51.5 trillion.…
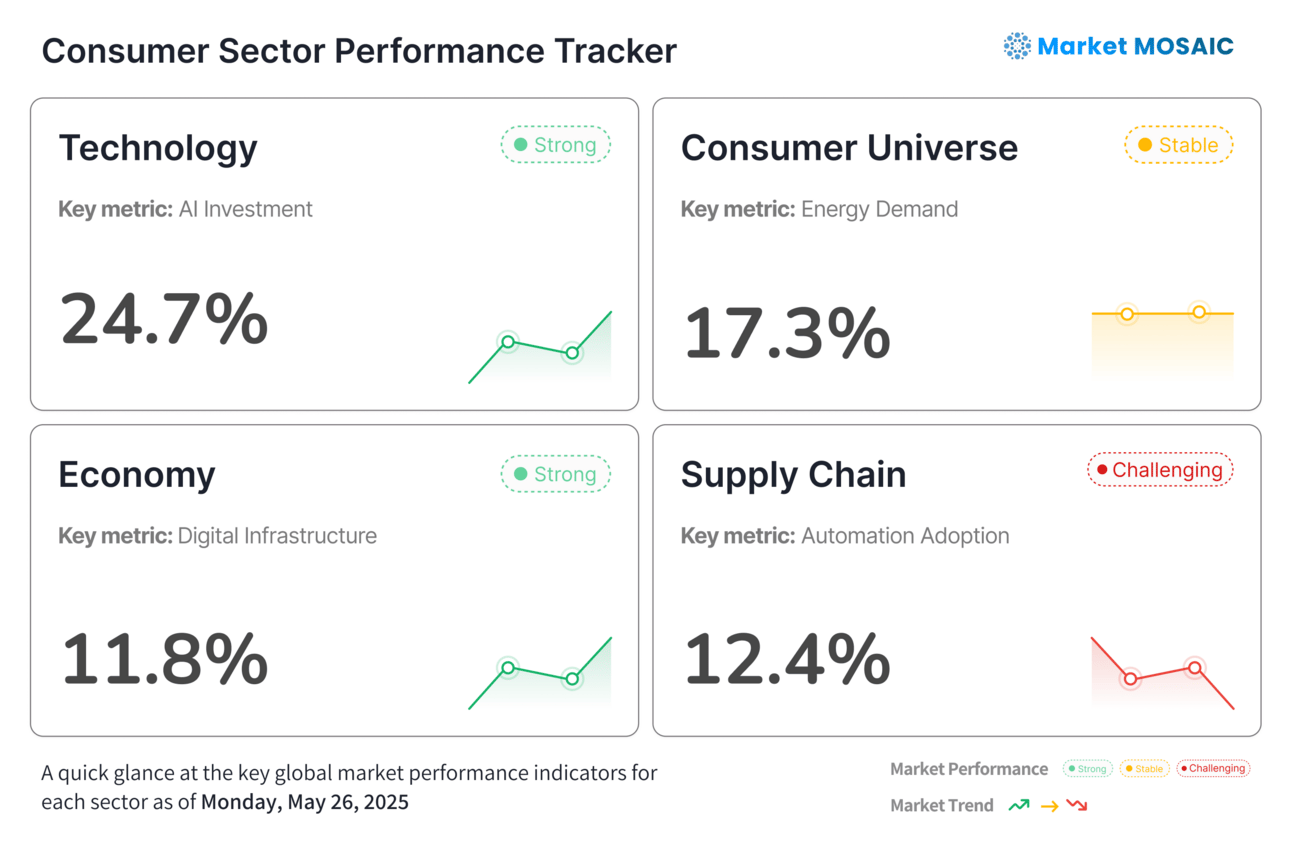 Sector trackerEdition #68
Sector Performance Tracker
This weekly market snapshot was compiled and analysed by Rwazi Insights
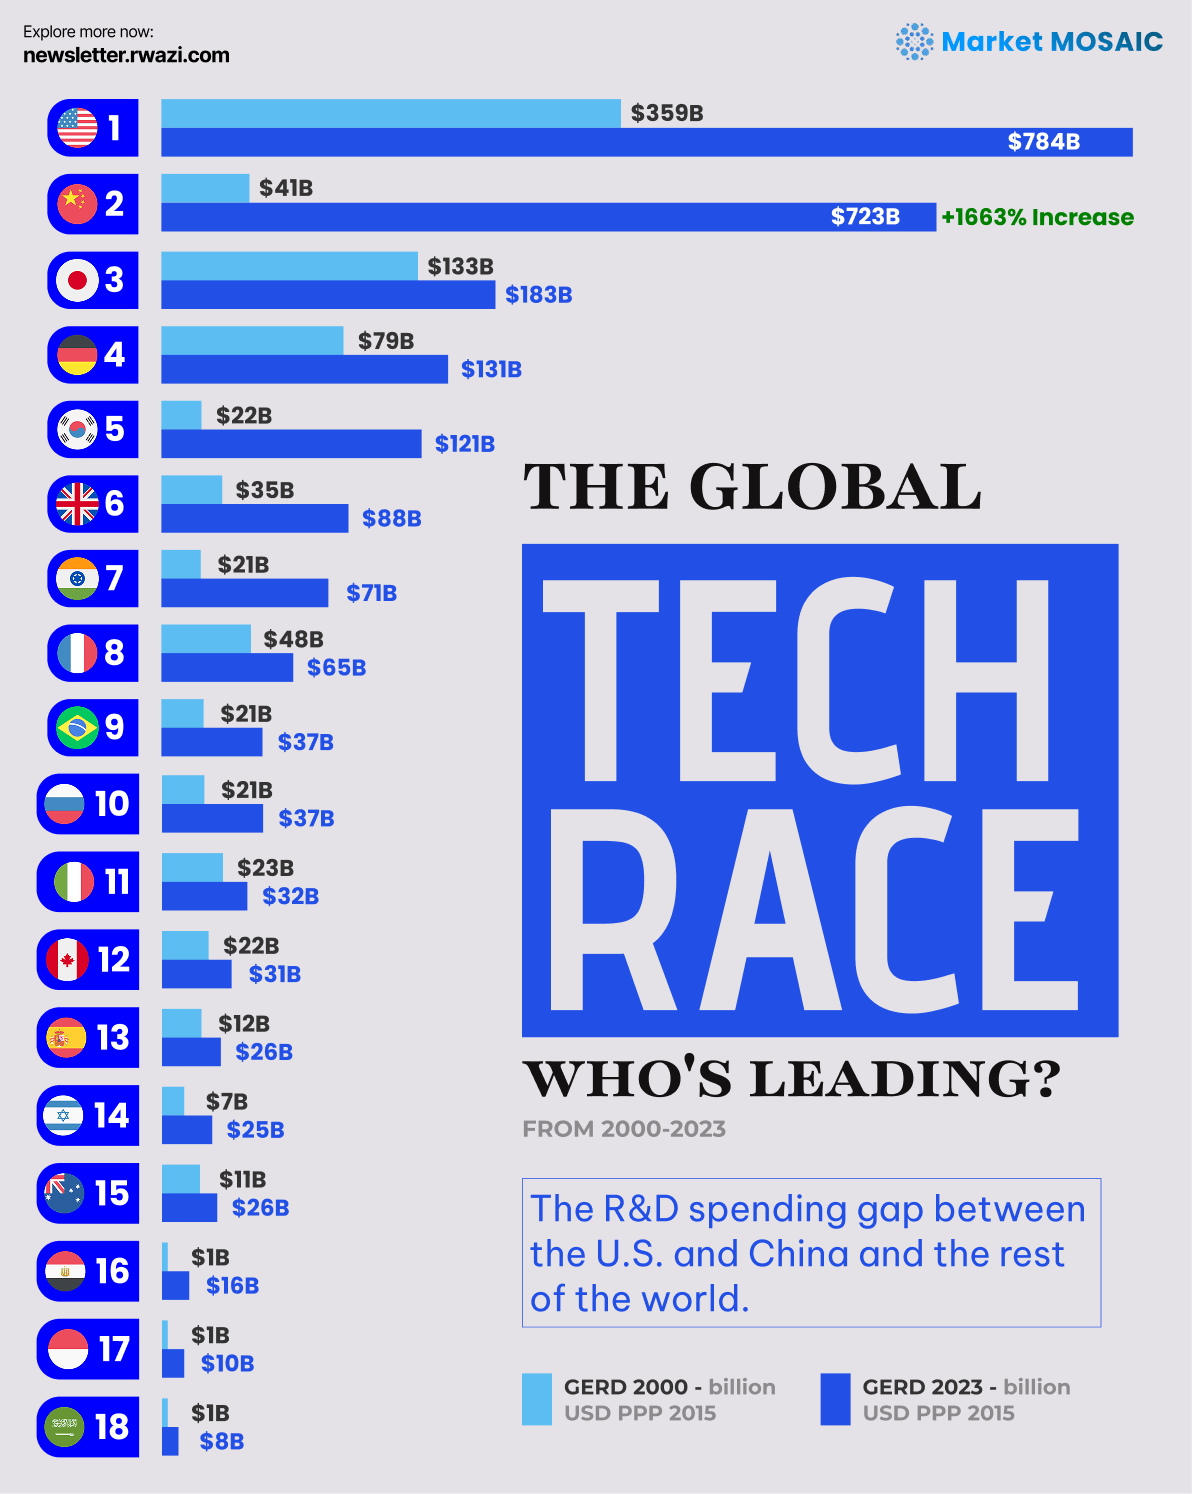 ChartEdition #67
Supply Chain
The global research and development ecosystem has undergone a dramatic transformation over the past two decades. Total R&D spending has nearly tripled in real terms, reaching an unprecedented $2.75 trillion in 2023. What's particularly striking is the redistribution of innovation power centres…
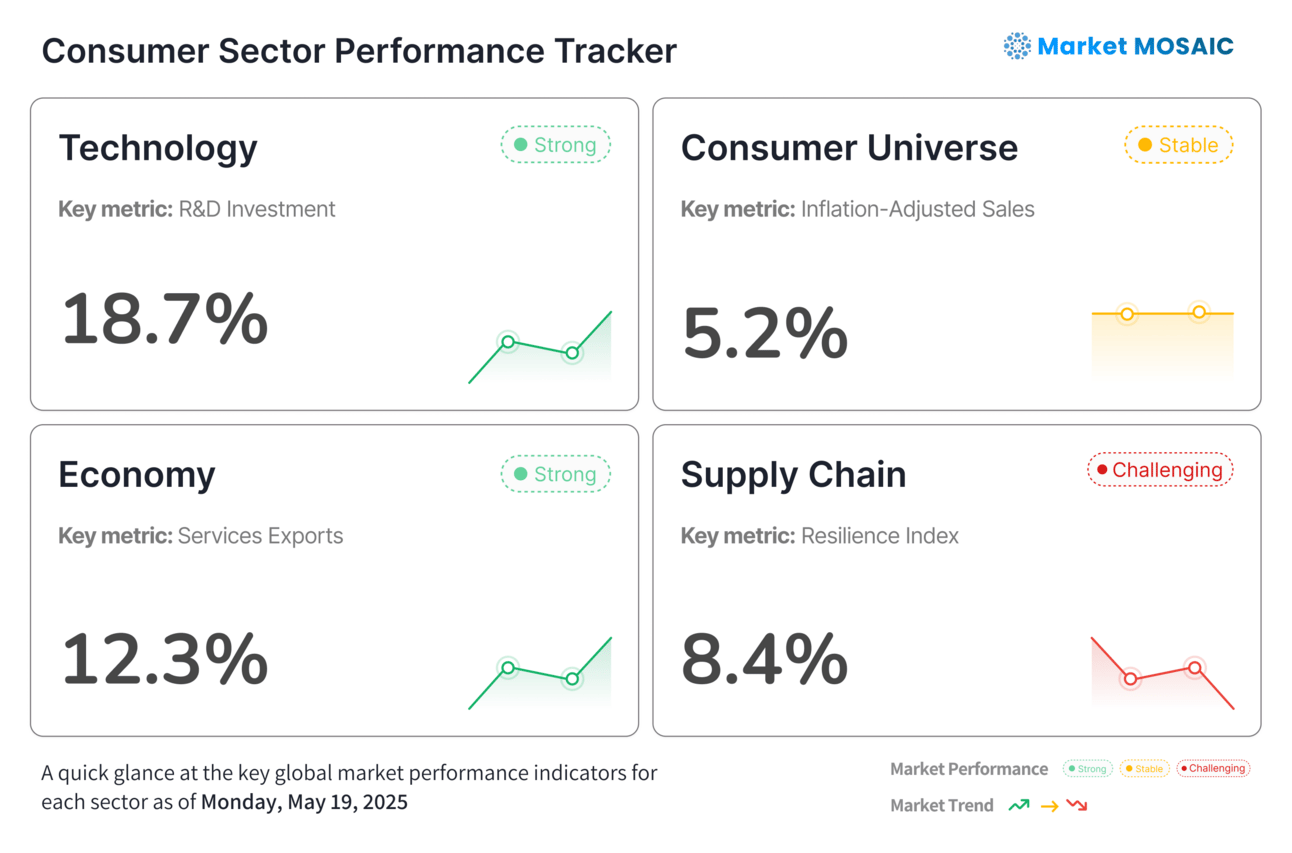 Sector trackerEdition #67
Sector Performance Tracker
This weekly market snapshot was compiled and analysed by Rwazi Insights
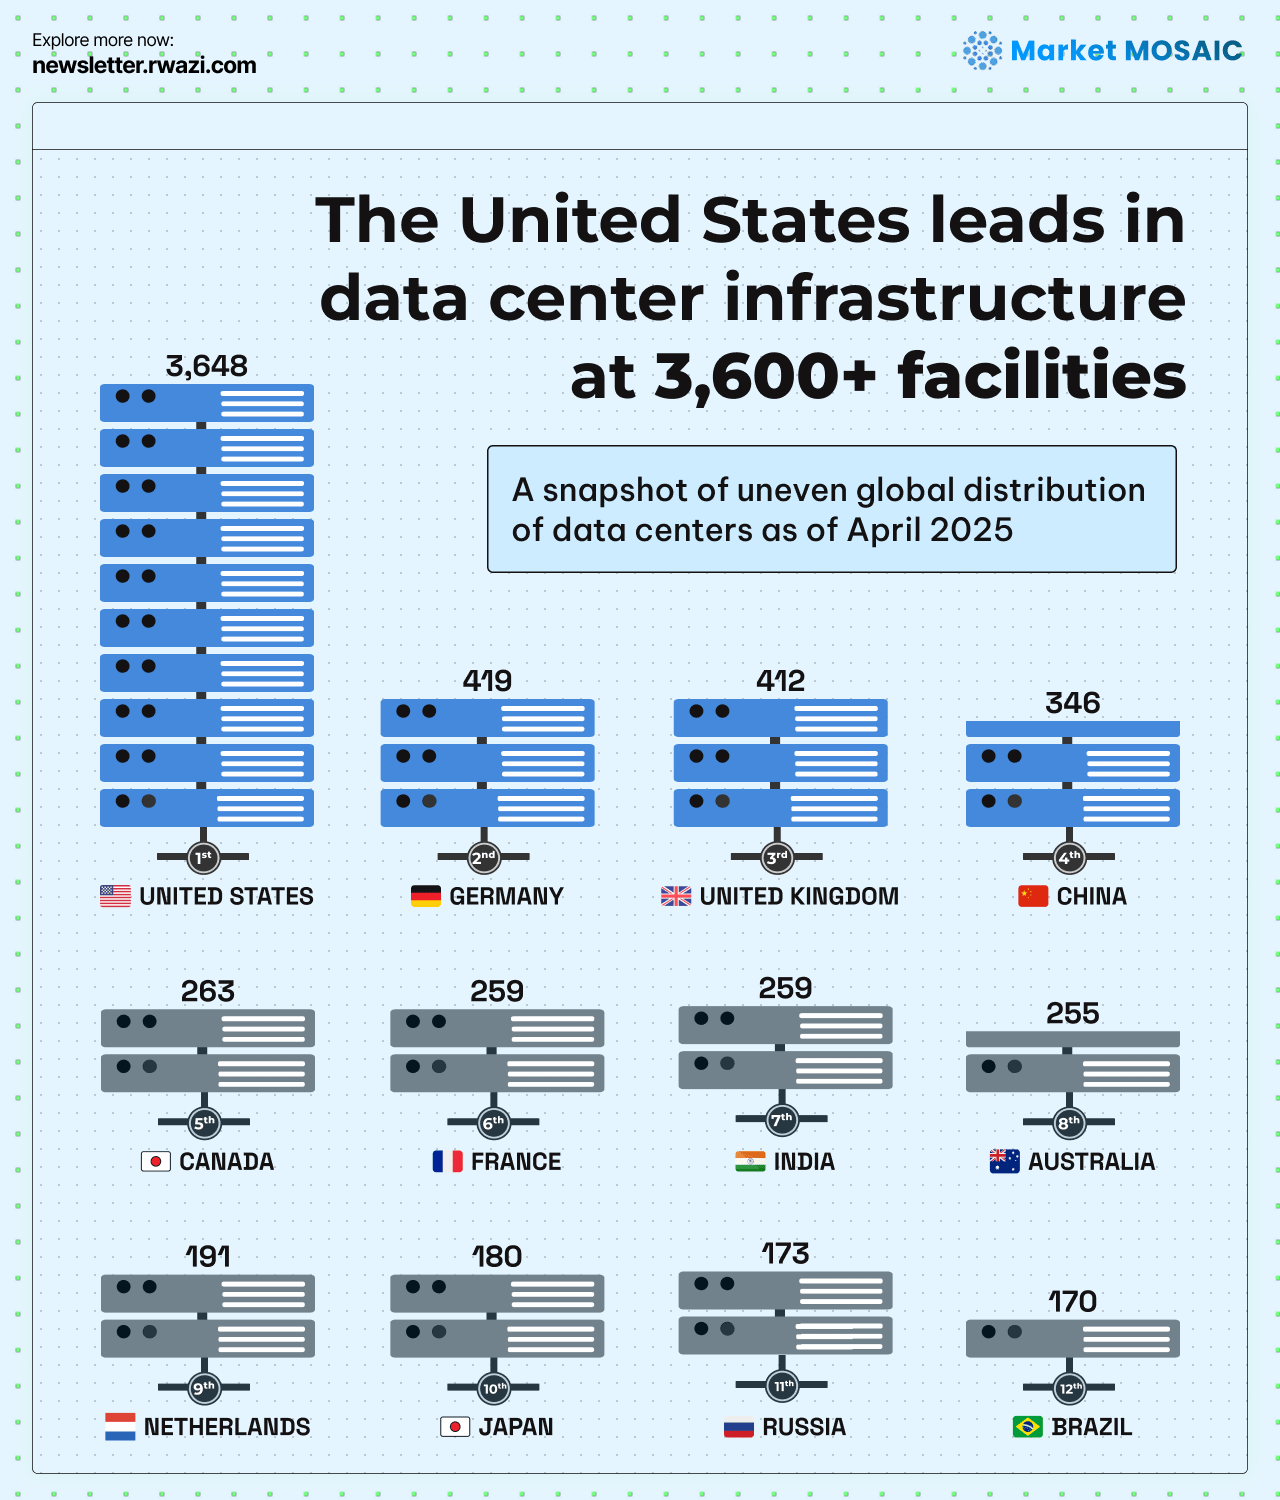 ChartEdition #66
Supply Chain
In a significant shift, Nvidia has announced plans to manufacture AI supercomputers entirely within the United States, with production facilities in Arizona and Texas. This move is now a new chapter in the global AI race, with ambitious plans to invest up to $500 billion in AI infrastructure over…
 ChartEdition #66
Nvidia's $500B bet will change everything you buy
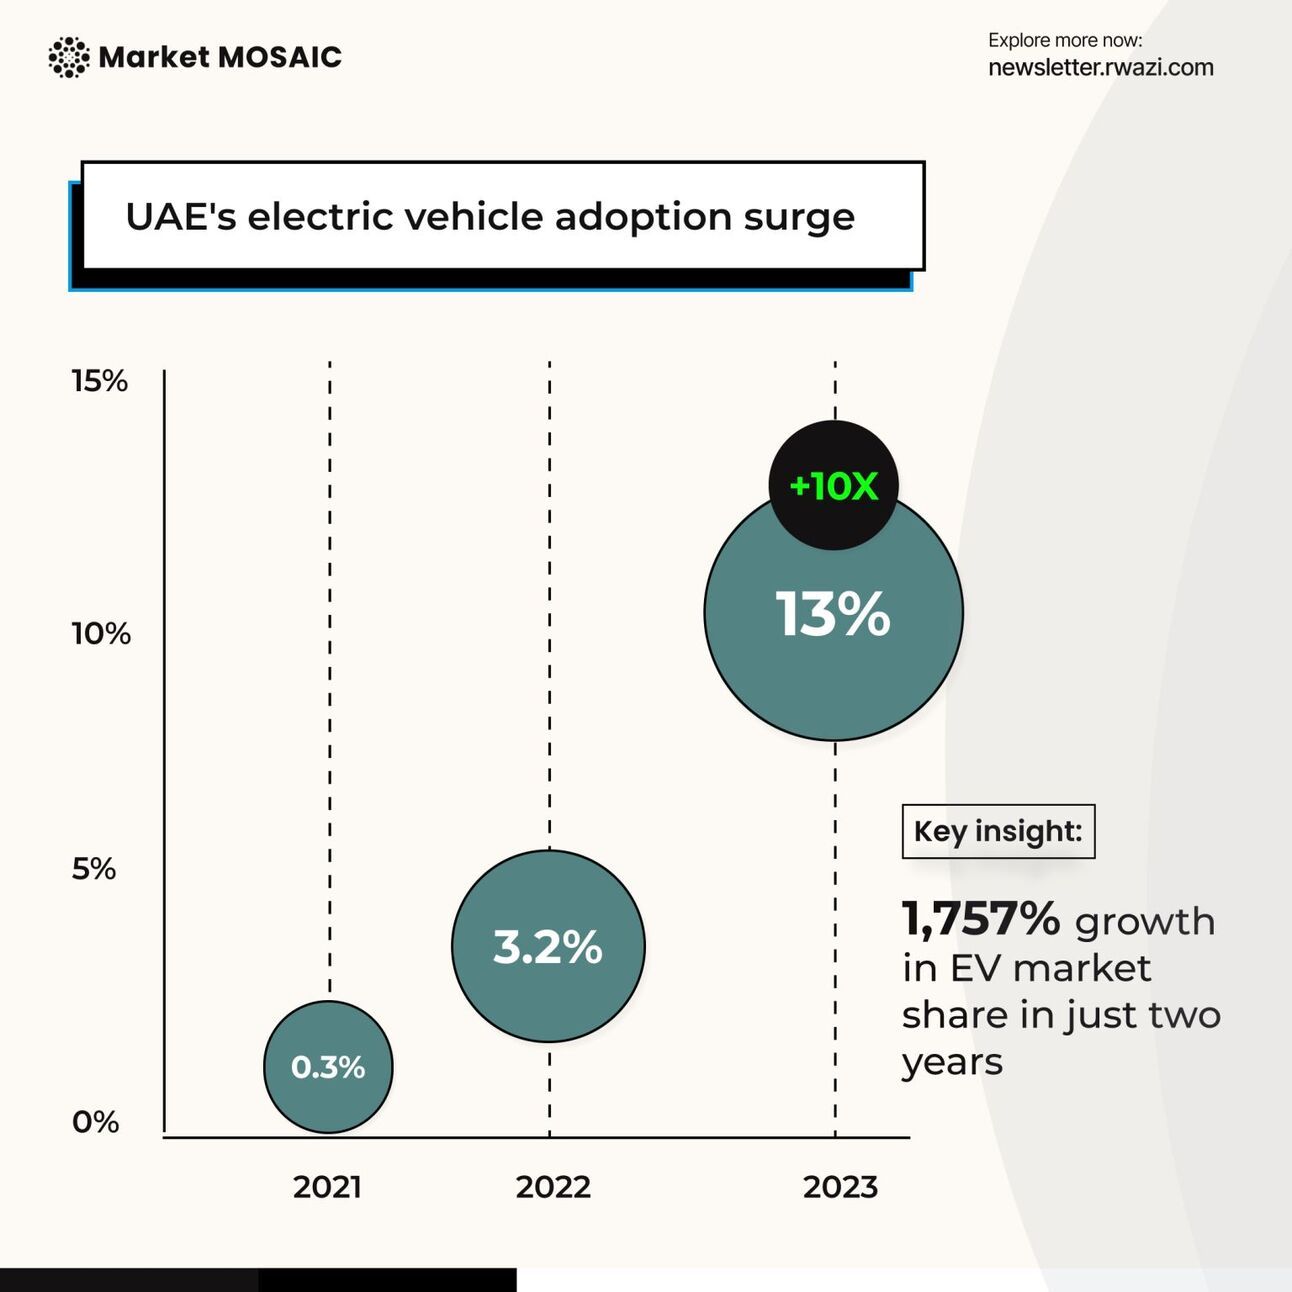
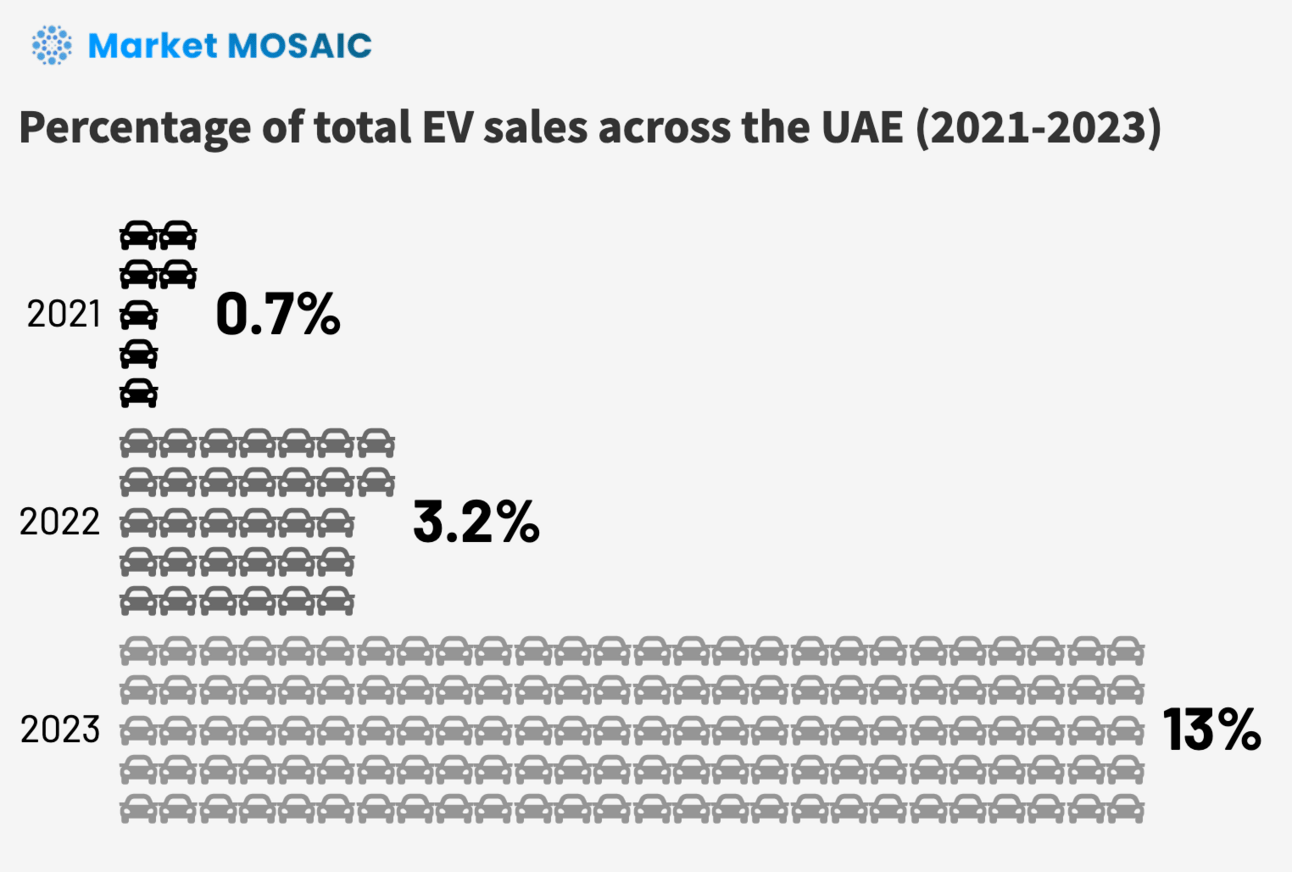
The United Arab Emirates (UAE) is now emerging as an unexpected leader in electric vehicle adoption in the Middle East, as it challenges assumptions about the pace of energy transitions in petroleum-producing nations. Our data analysis shows a dramatic growth in the UAE's EV market, with electric…
 Sector trackerEdition #66
Sector Performance Tracker
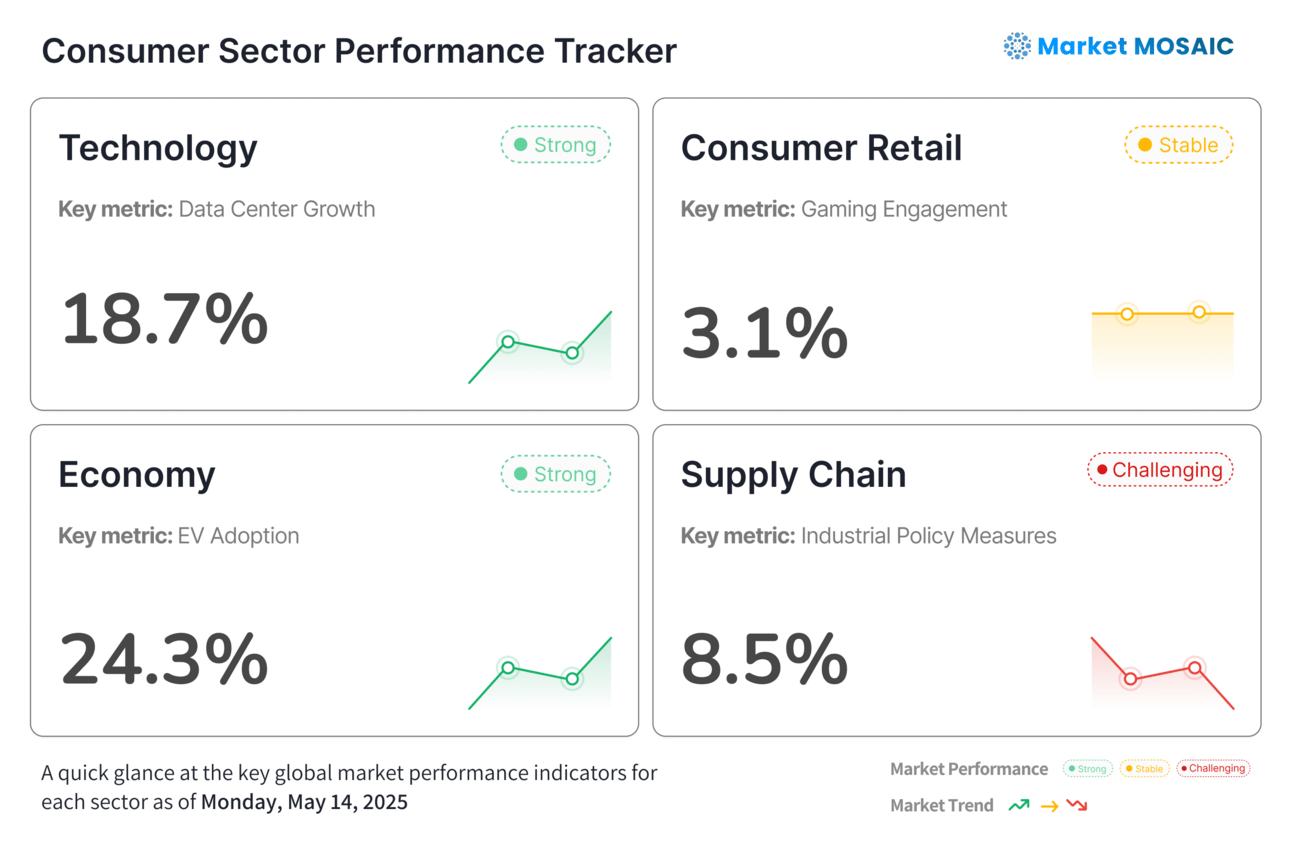
This weekly market snapshot was compiled and analysed by Rwazi Insights
 ChartEdition #65
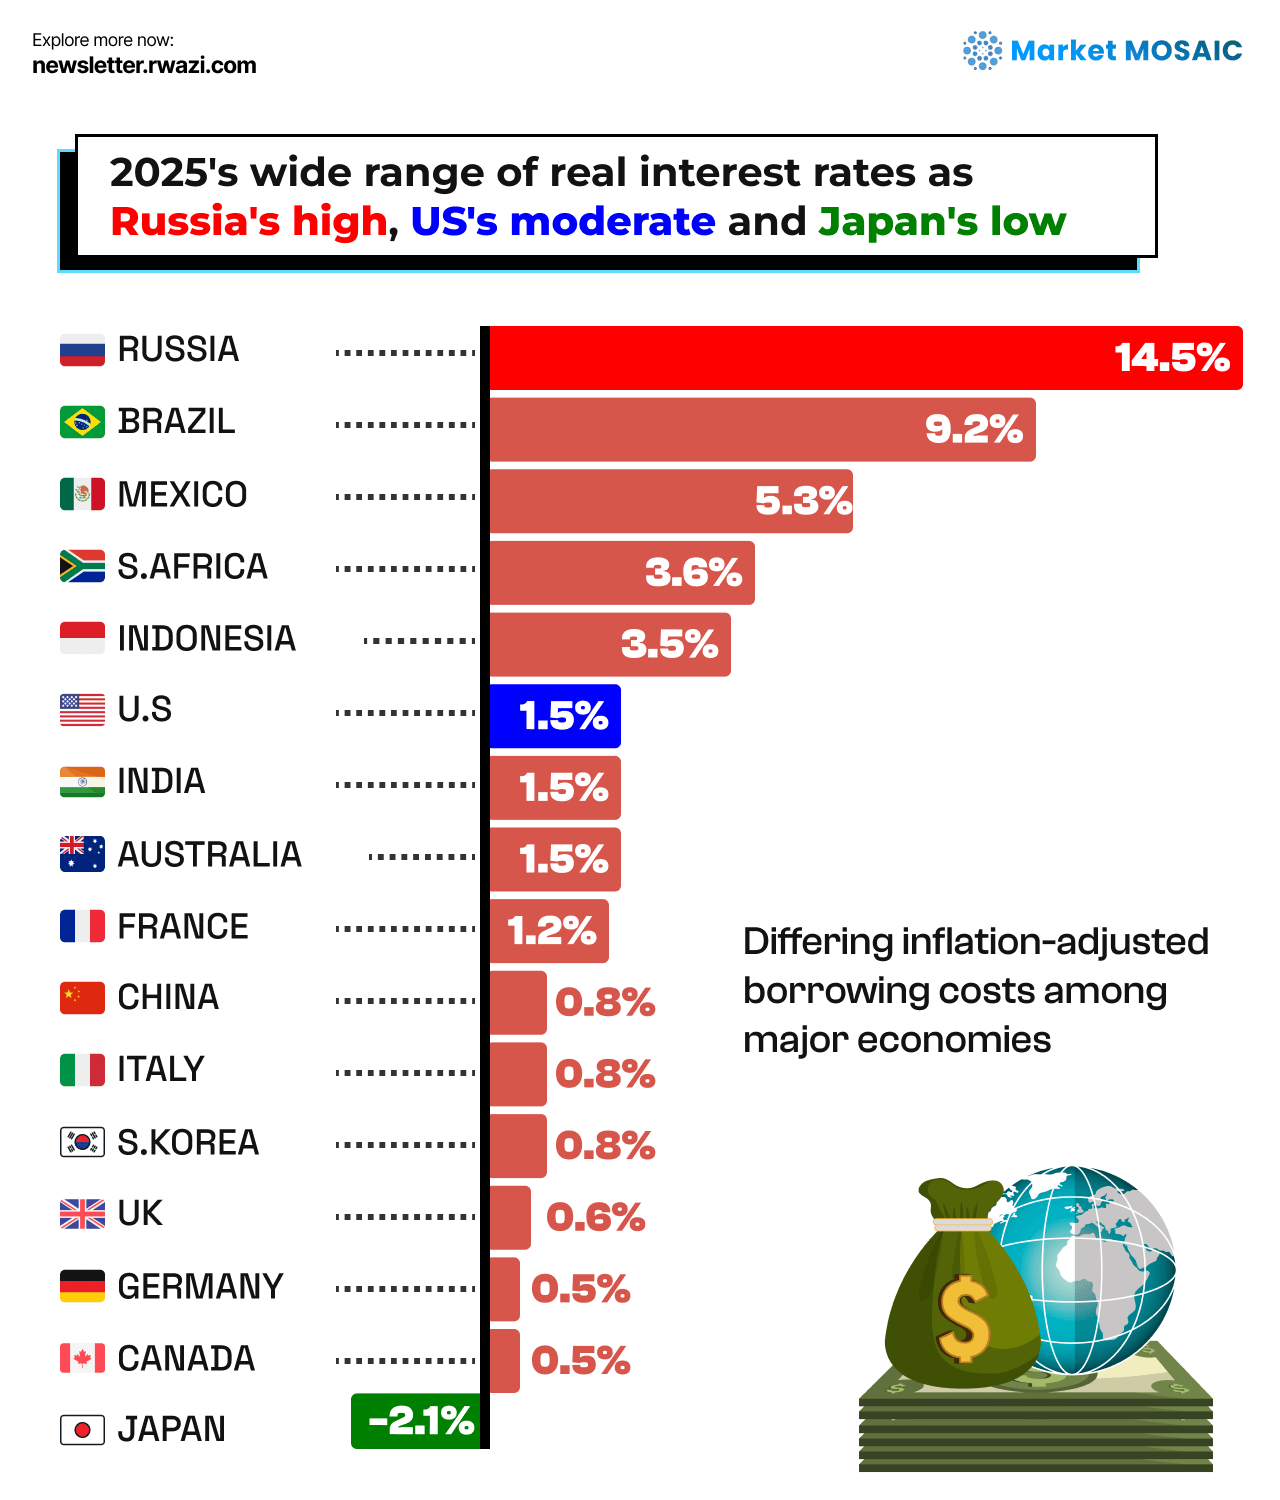
China's exports surge 13.6x as Brazil's 9.2% interest rate tops global chart
Our data of analysis of World Economic Outlook data has shown a significant variation in real interest rates across major economies, highlighting divergent monetary policy approaches and economic conditions worldwide. Russia currently maintains the highest real interest rate at 14.5%, as its…
 Sector trackerEdition #65
Sector Performance Tracker
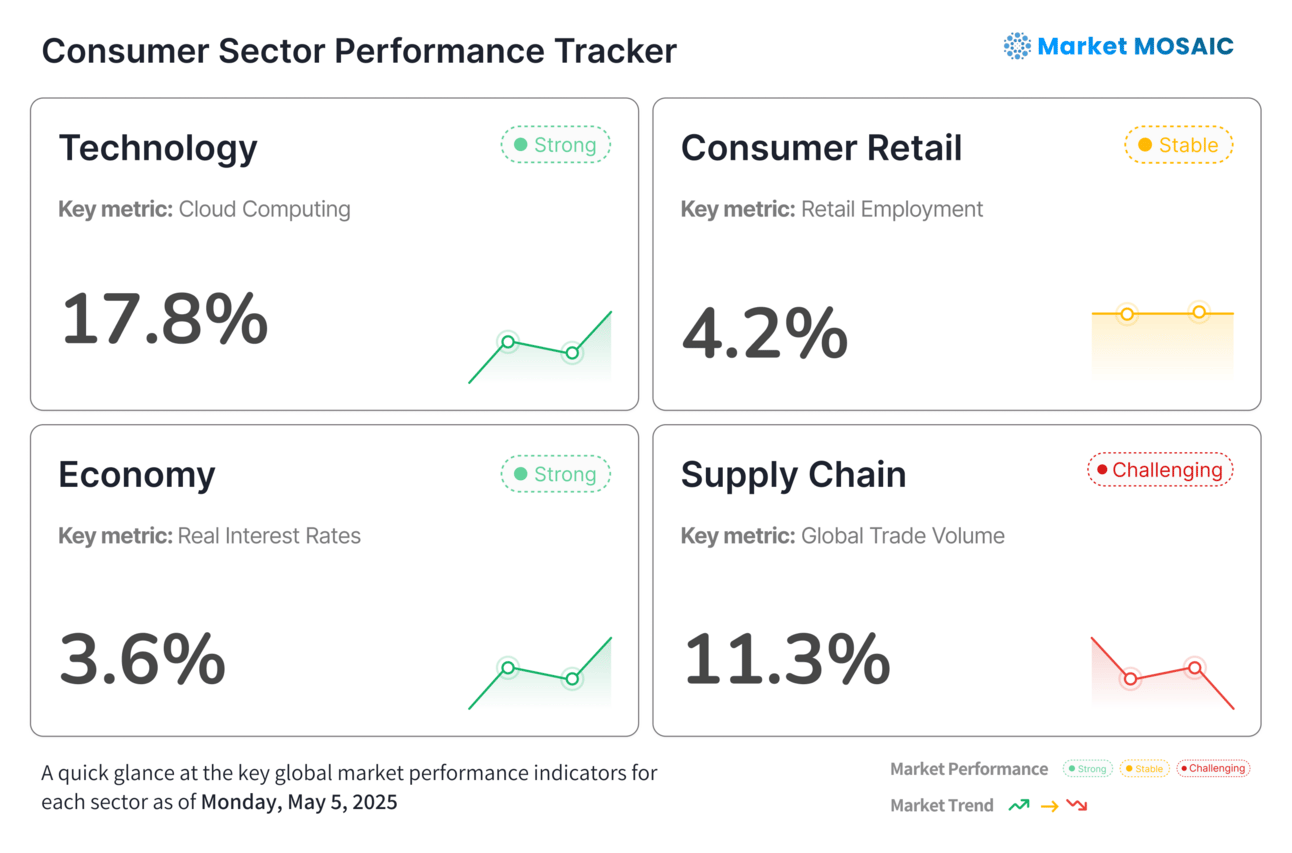
This weekly market snapshot was compiled and analysed by Rwazi Insights
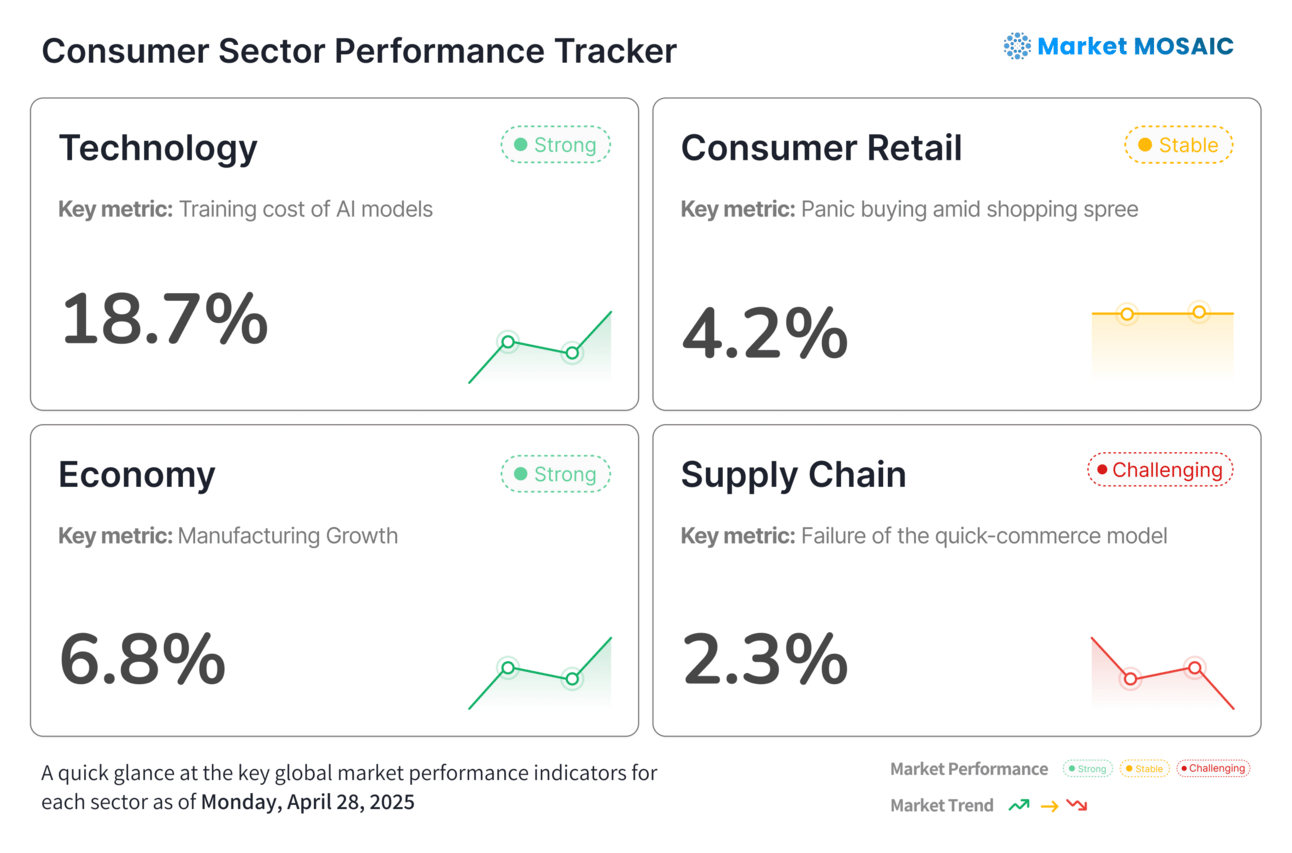 Sector trackerEdition #64
Sector Performance Tracker
This weekly market snapshot was compiled and analysed by Rwazi Insights
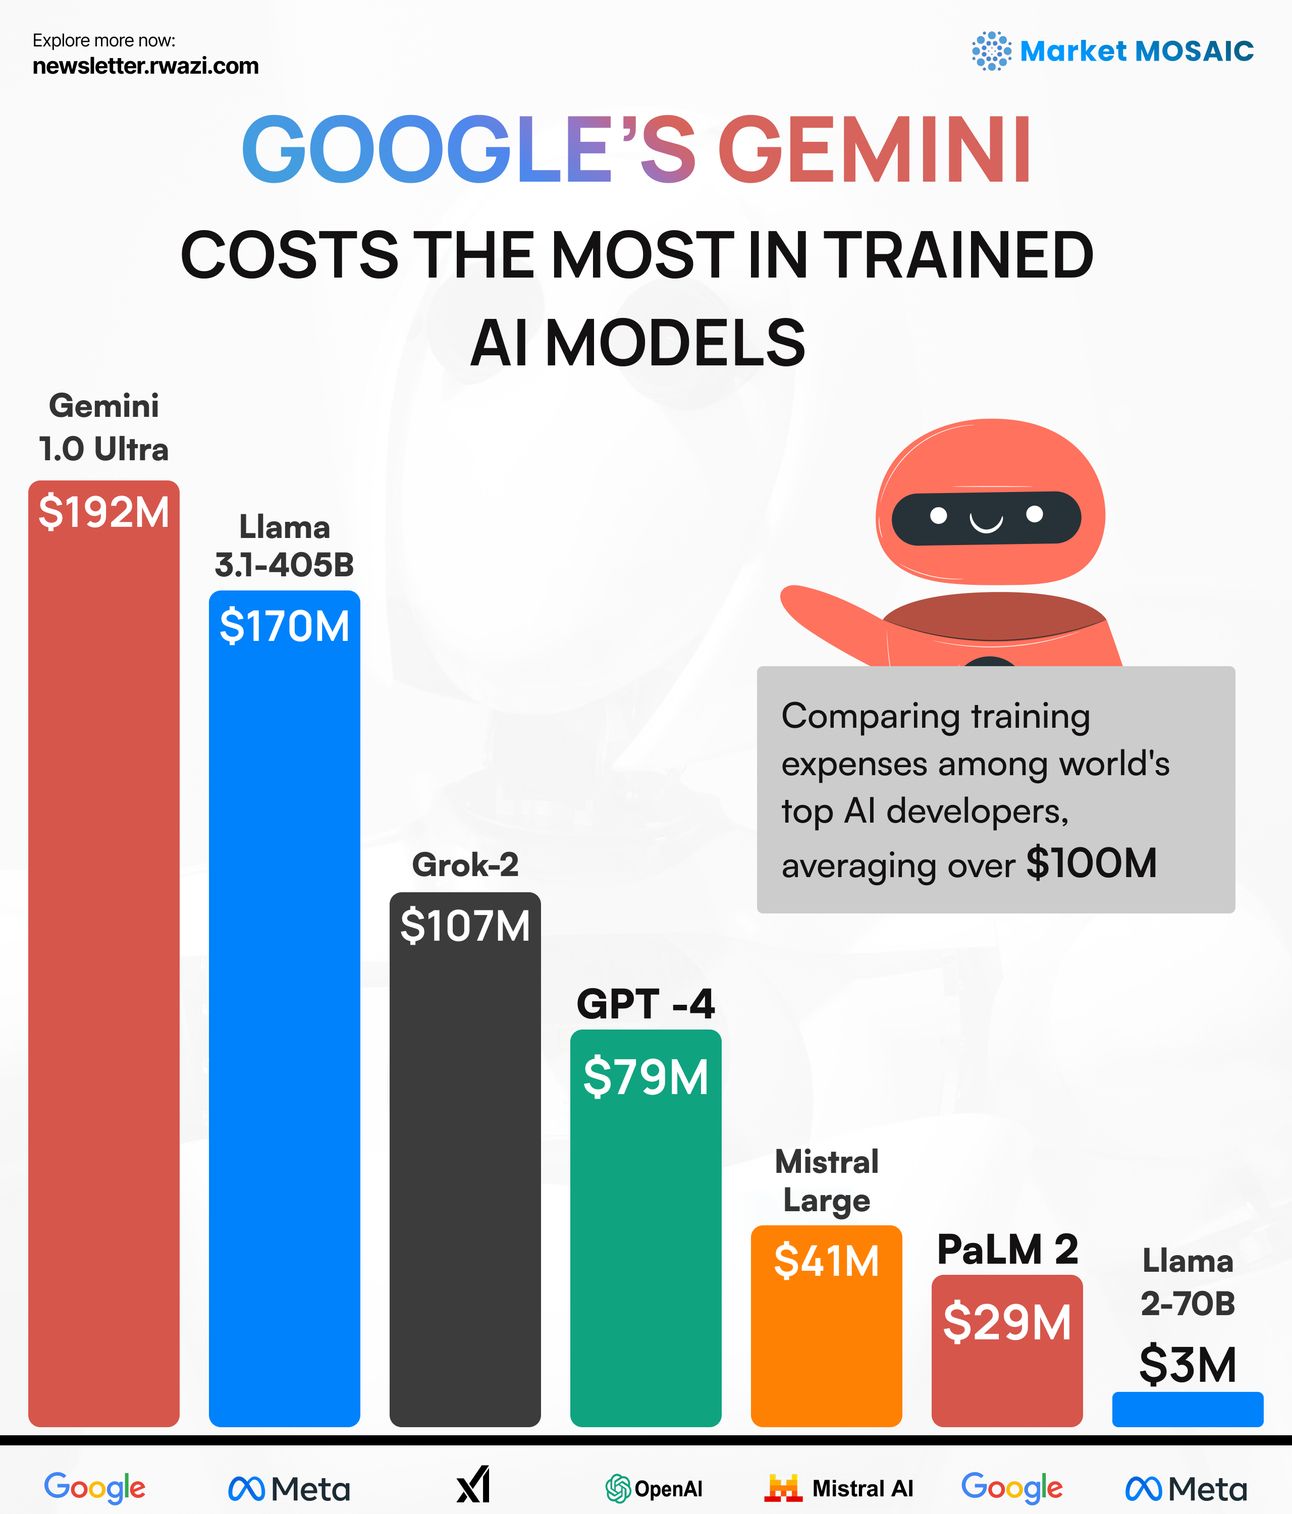 ChartEdition #64
The billion-dollar race for AI supremacy
The competition in artificial intelligence continues to be defined by massive capital investments, with training costs now reaching unprecedented levels. Our data analysis shows that Google's Gemini 1.0 Ultra model commanded $192 million in training expenses alone, setting a new benchmark for the…
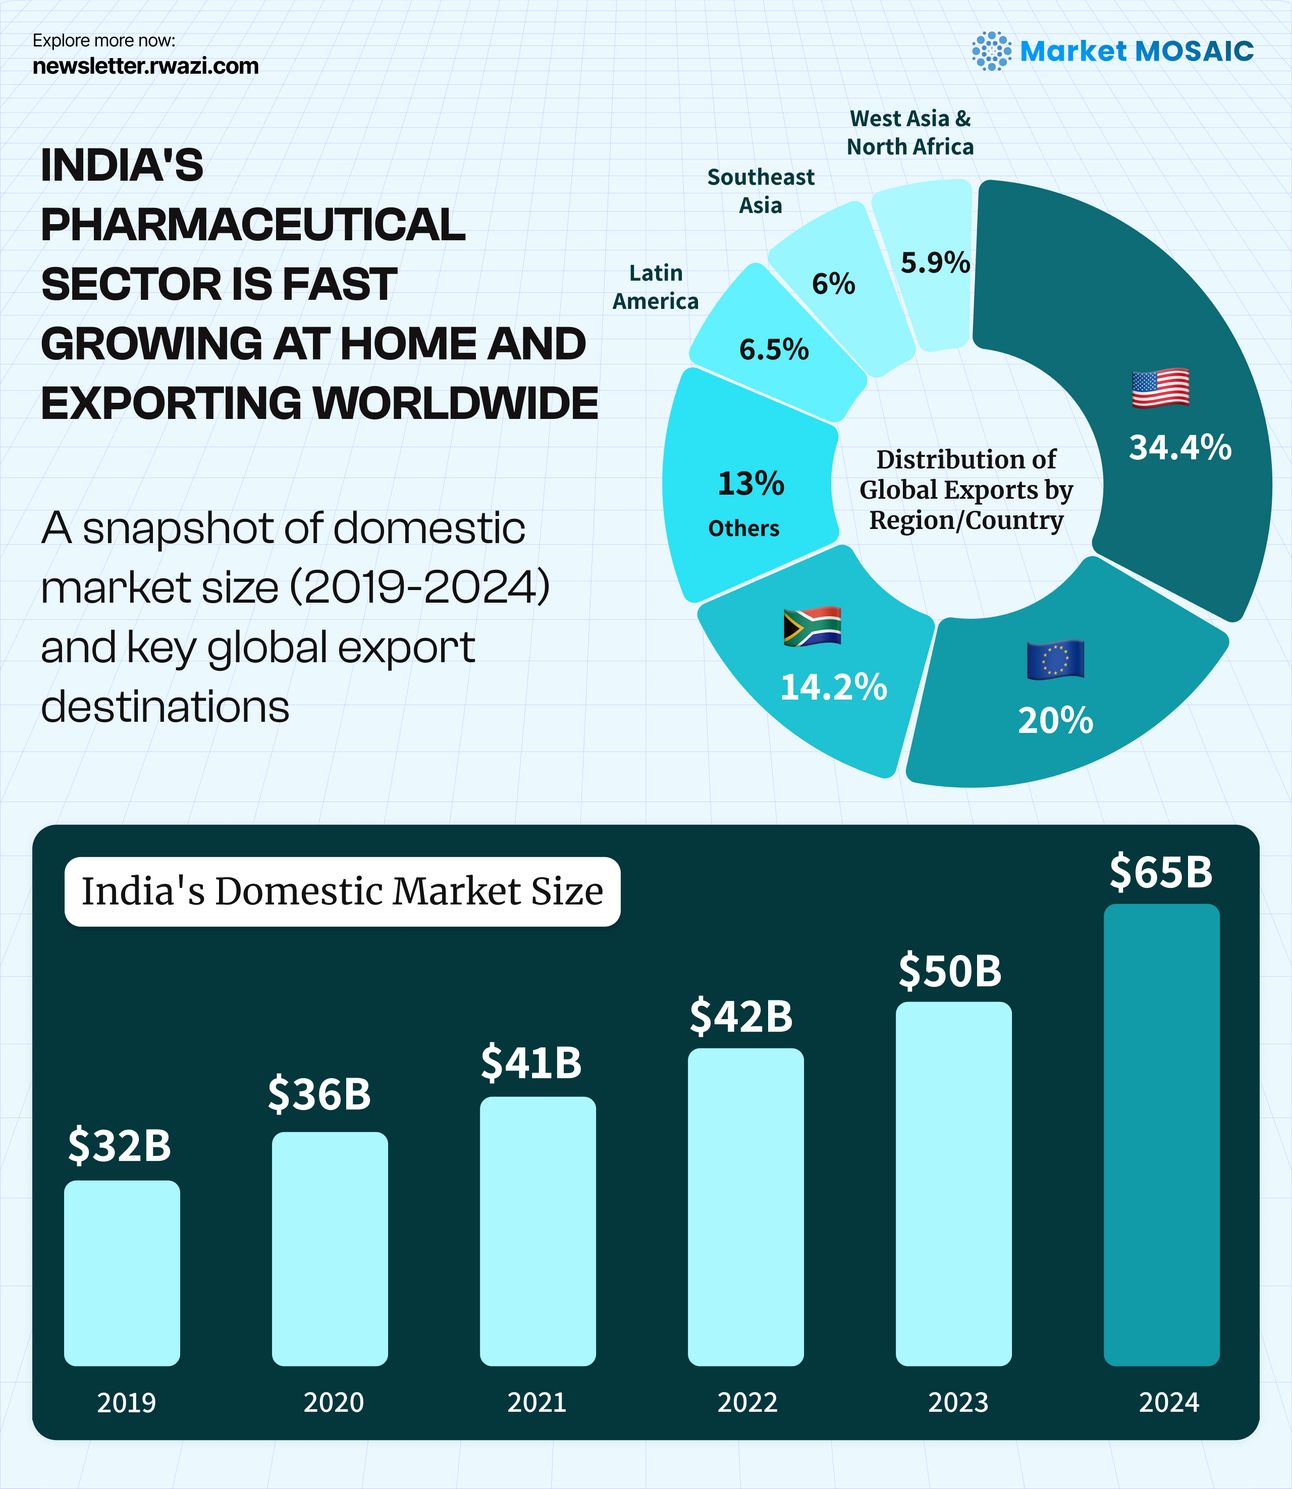 ChartEdition #63
India's pharmaceutical industry changes the market game
India's pharmaceutical sector continues its remarkable growth trajectory, with our analysis showing the market is on track to reach $65 billion in 2024, nearly doubling from $32 billion in 2019. The country's strategic position as a global pharmaceutical powerhouse is strengthening, with 34.4% of…
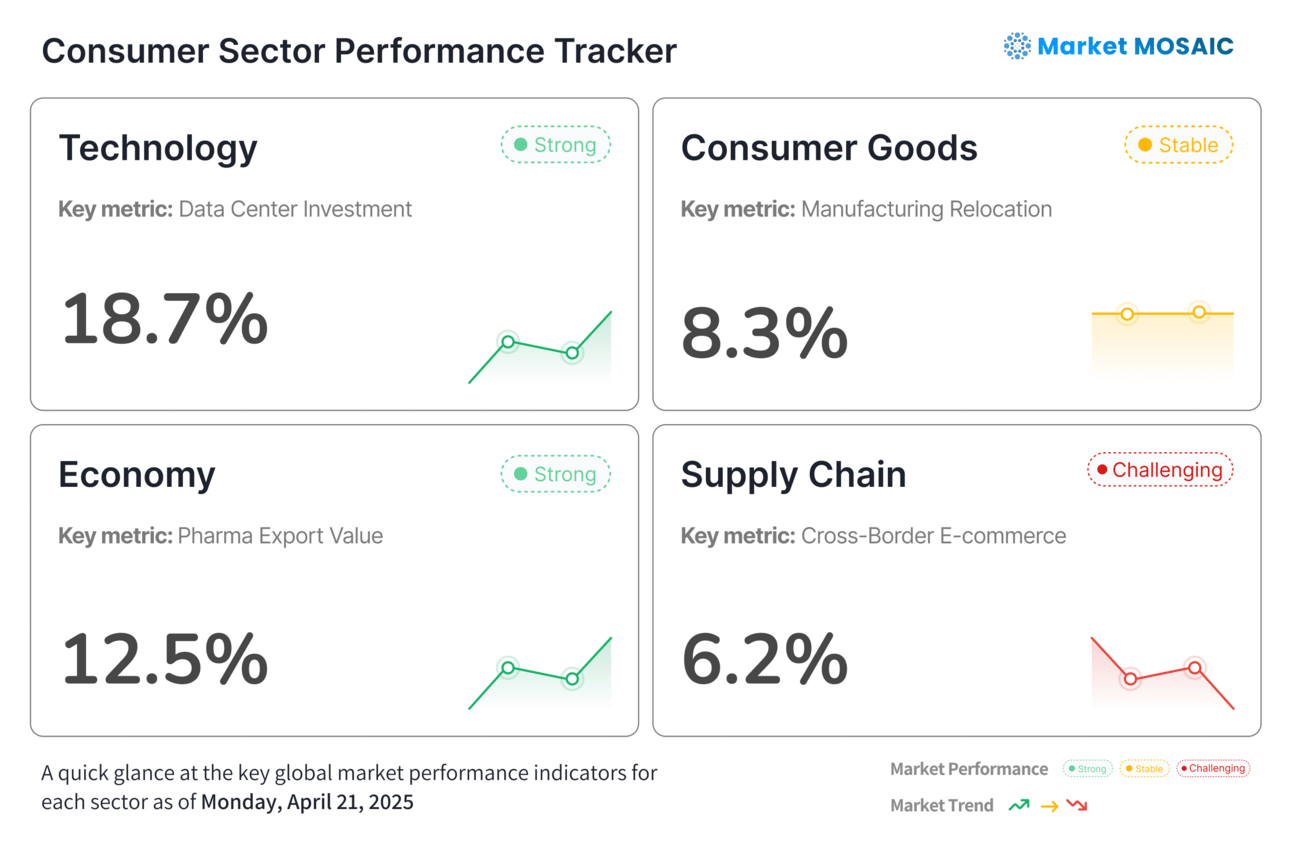 Sector trackerEdition #63
Sector Performance Tracker
This weekly market snapshot was compiled and analysed by Rwazi Insights
 ChartEdition #62
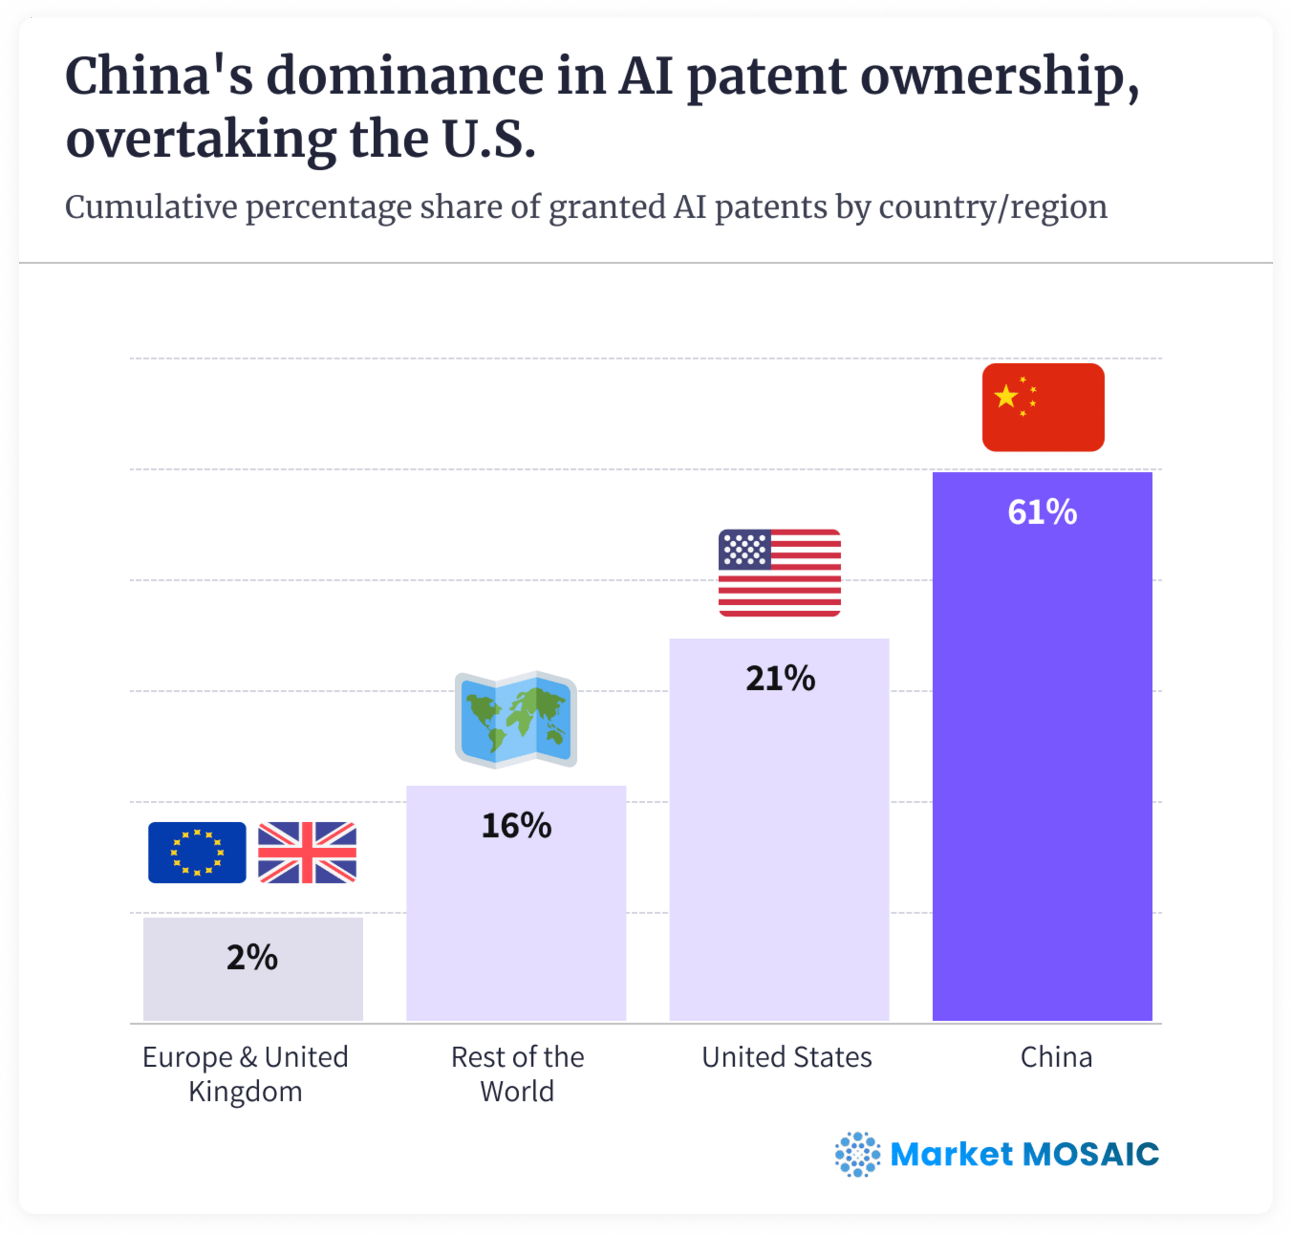
China's AI ecosystem accelerates despite restrictions
Interestingly, China's AI wave is experiencing unprecedented growth despite international chip restrictions. DeepSeek's emergence as a leading AI model has shifted the country's innovation approach, with Chinese tech giants releasing a wave of free, open-source models that are accelerating AI…
 Sector trackerEdition #62
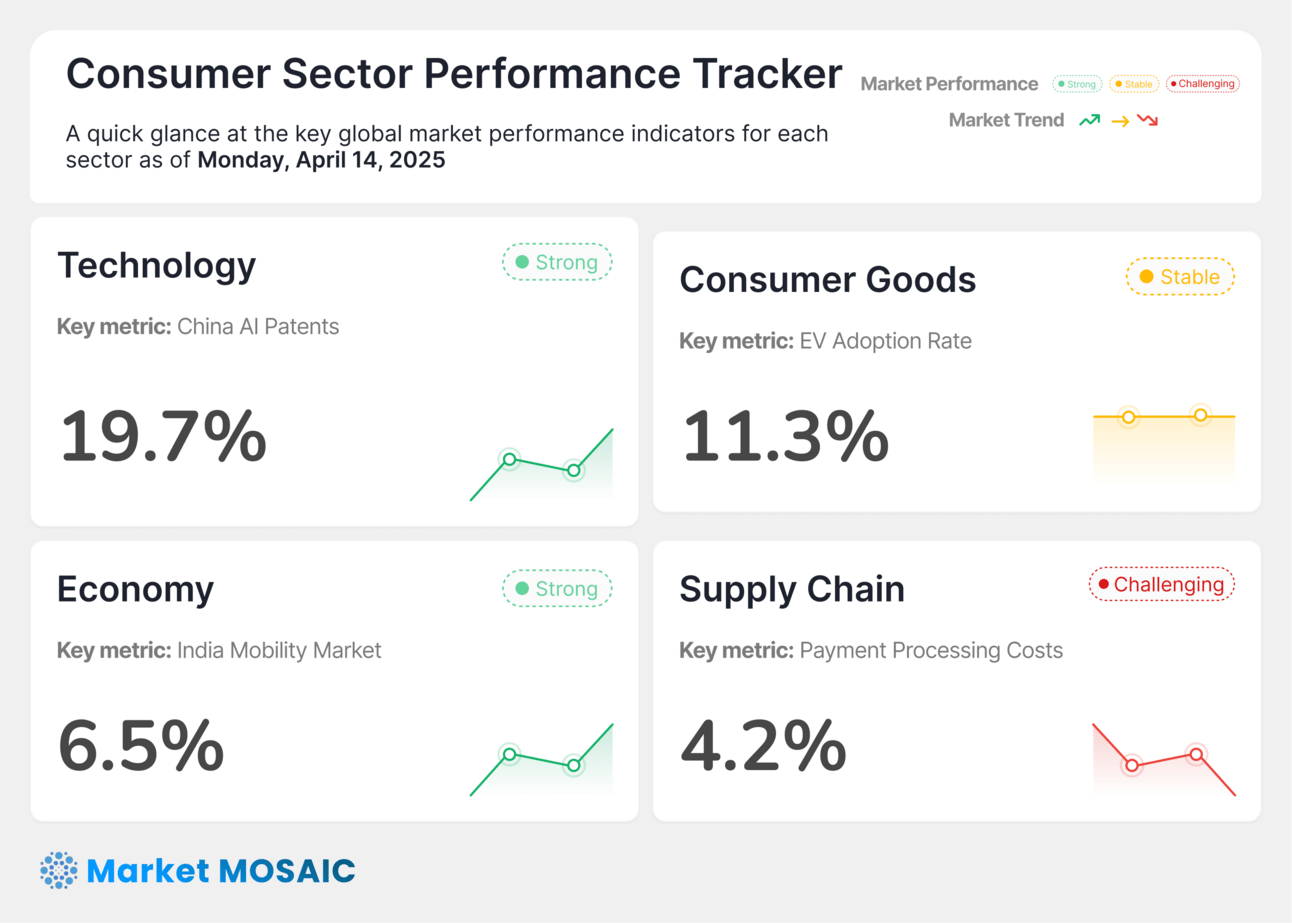
Sector Performance Tracker
This weekly market snapshot was compiled and analyzed by Rwazi Insights
 ChartEdition #61
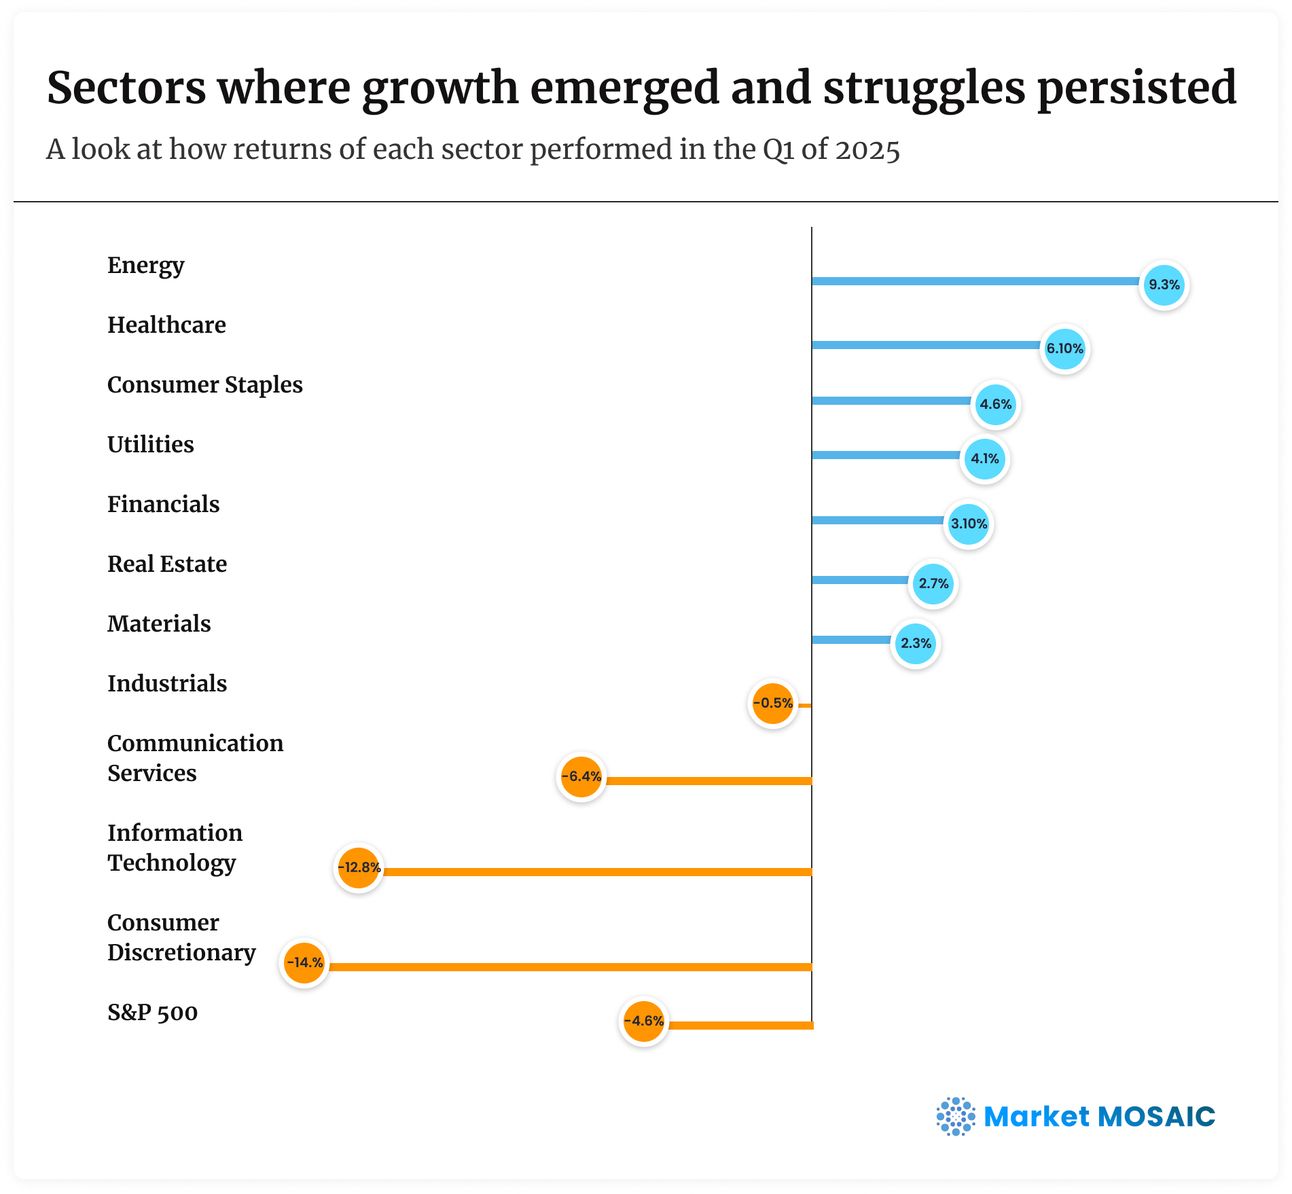
Sectors of global markets navigate turbulent waters
Global investors are preparing for continued market volatility following the implementation of US tariffs. Chinese markets experienced significant declines, while Taiwan implemented temporary controls on short-selling to mitigate the turmoil. Meanwhile, Middle East markets recorded their worst…
 Sector trackerEdition #61
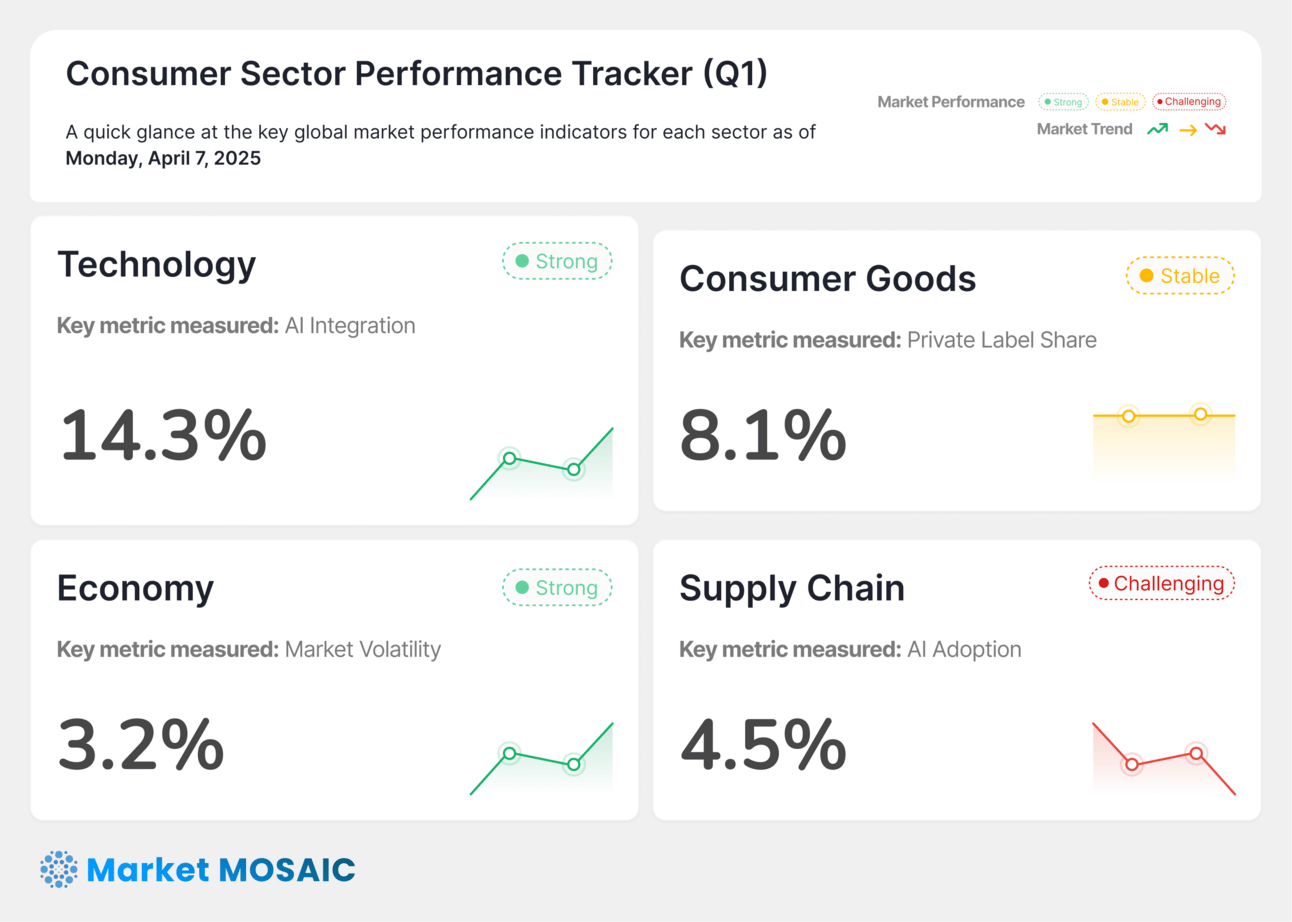
Sector Performance Tracker
This weekly market snapshot was compiled and analyzed by Rwazi Insights
 ChartEdition #60
The U.S. and Abu Dhabi's massive AI infrastructure play
Abu Dhabi is doubling down on its global AI investment strategy with a landmark $25 billion partnership between sovereign wealth fund ADQ and US firm Energy Capital Partners. This collaboration will develop 25 GW of power generation infrastructure in the United States, specifically targeting the…
 Sector trackerEdition #60
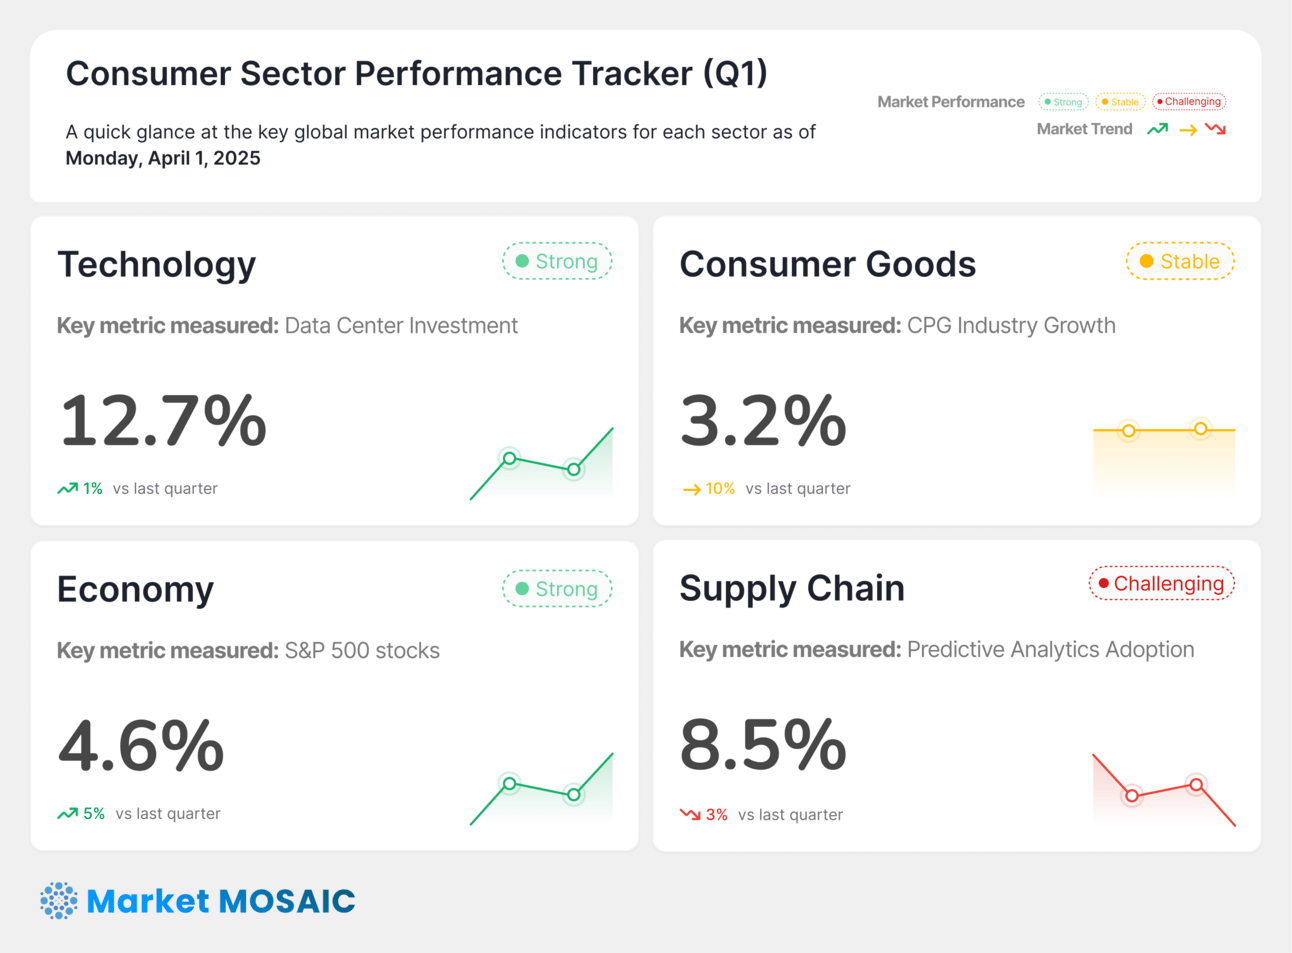
Sector Performance Tracker
This weekly market intelligence dashboard was compiled and analyzed by Rwazi Insights
 ChartEdition #59
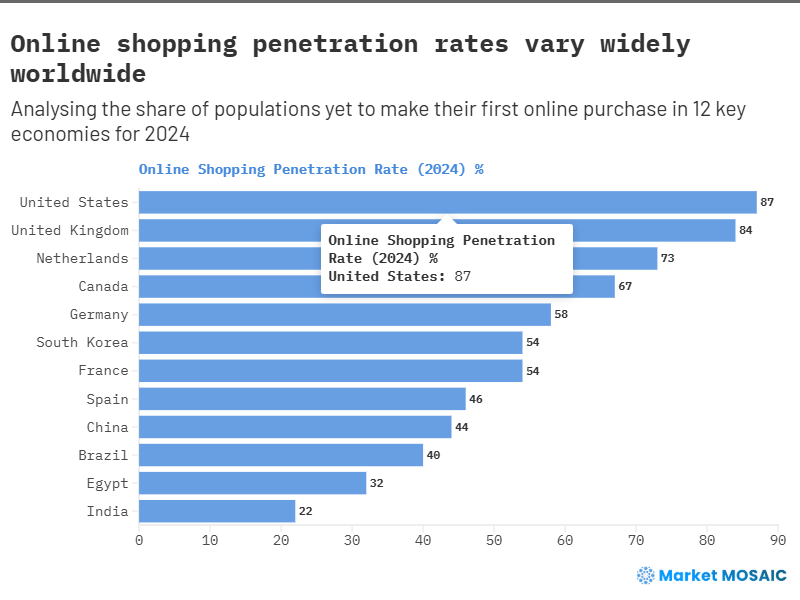
Consumer spending fatigue finally emerges
A significant economic trend is emerging: Retailers and businesses are witnessing a profound shift in purchasing behaviors driven by economic uncertainty.
 ChartEdition #59
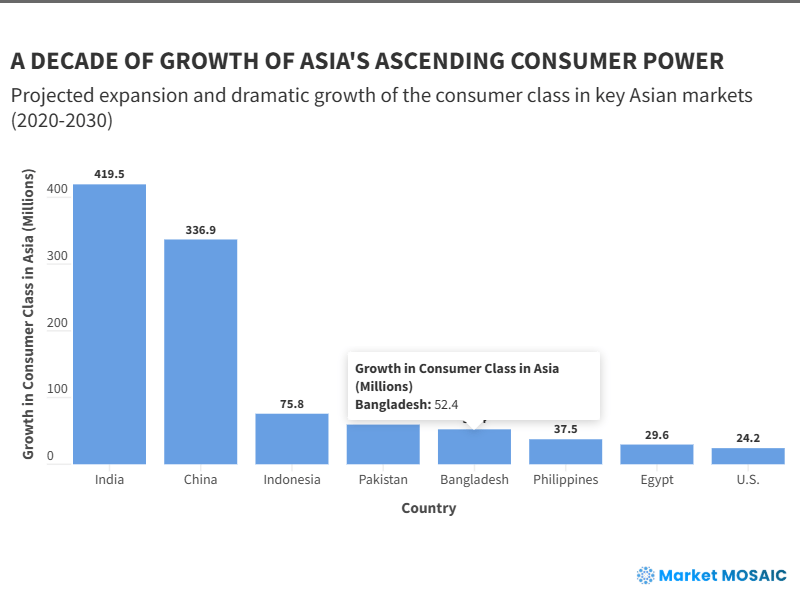
When the world's largest retailers whisper, global markets listen
Walmart's conservative growth forecast has sent ripples through global markets across the world, particularly Asia (a growing consumer powerhouse) with the retail giant projecting only 3-4% full-year sales growth compared to last year's 5.1%.
 Sector trackerEdition #59
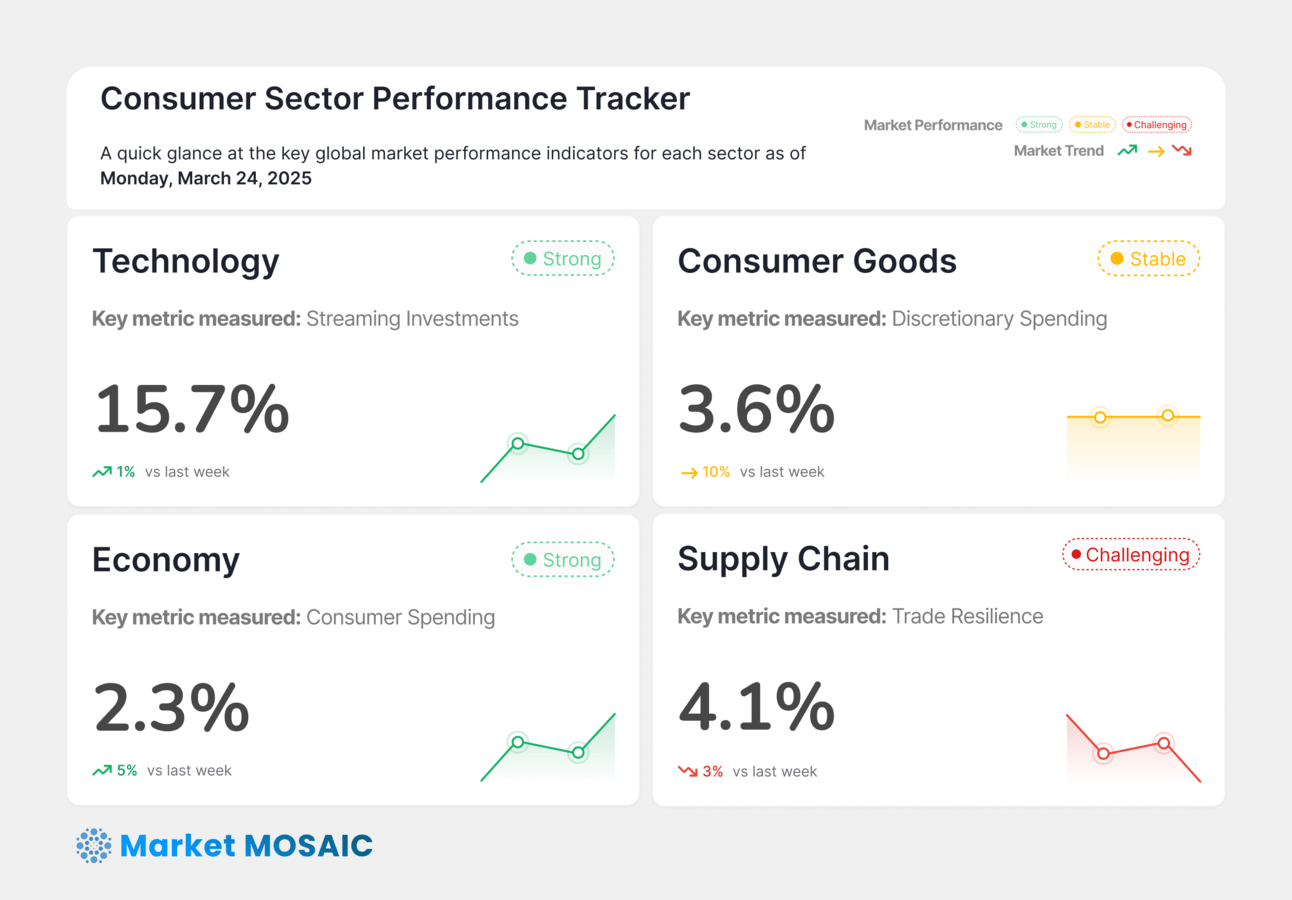
Sector Performance Tracker
This weekly market intelligence dashboard was compiled and analyzed by Rwazi Insights
 ChartEdition #58
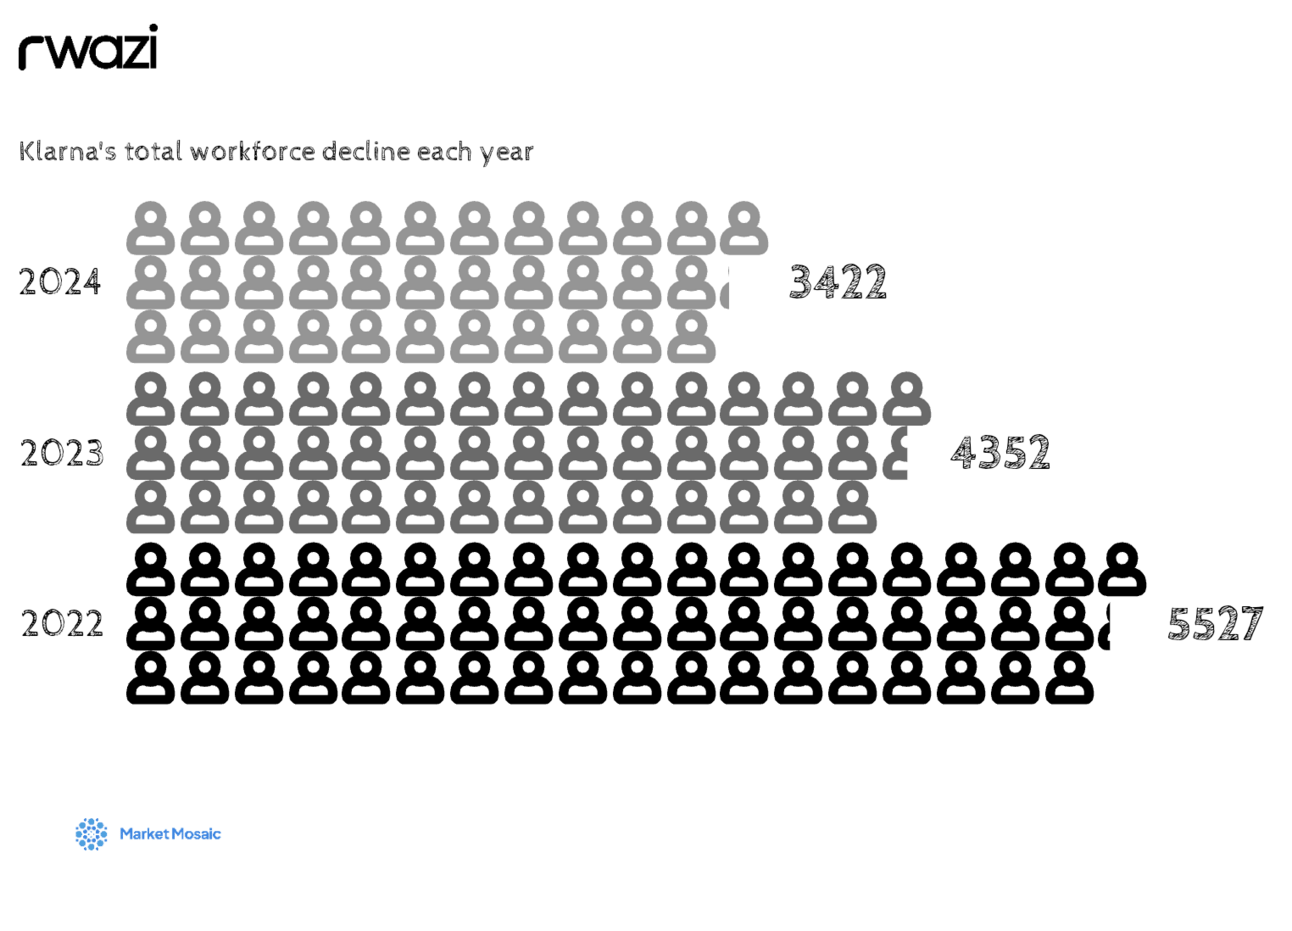
When consumer spending pullback spans income levels
A concerning trend is emerging across retail landscapes: consumers at all income levels are pulling back on spending, even for necessities. Our data analysis from retail locations across multiple markets confirms these warning signals from major retailers.
 Sector trackerEdition #58
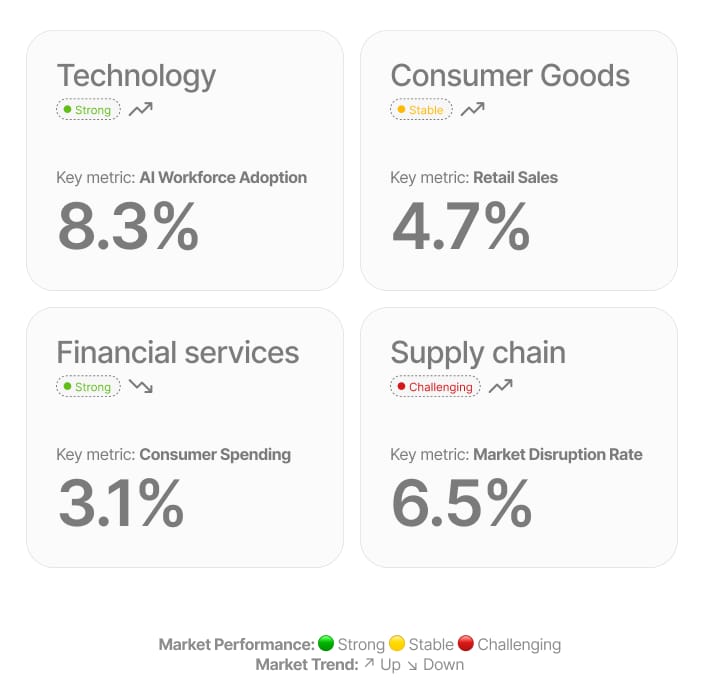
Sector Performance Tracker
This weekly market intelligence dashboard was compiled and analyzed by Rwazi Insights as of Monday, March 17, 2025
 Sector trackerEdition #57
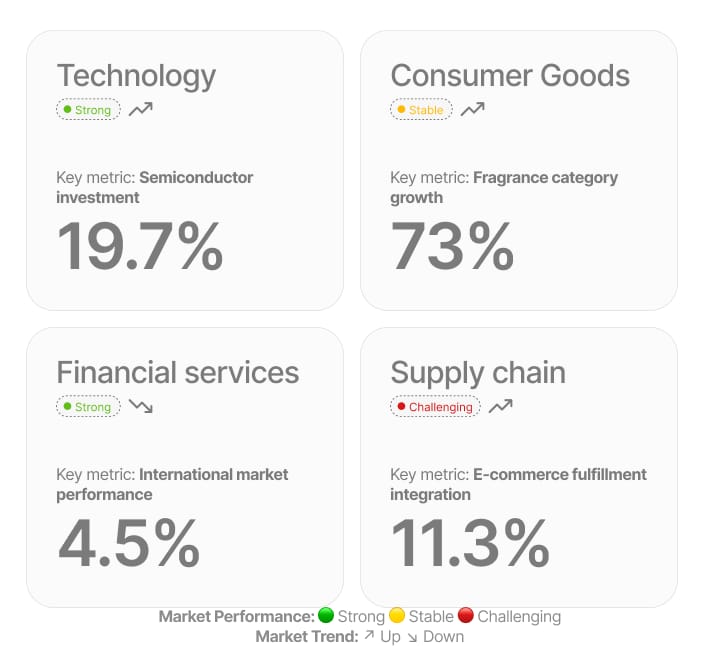
Sector Performance Tracker
This weekly market intelligence dashboard was compiled and analyzed by Rwazi Insights as of Monday, March 11, 2025
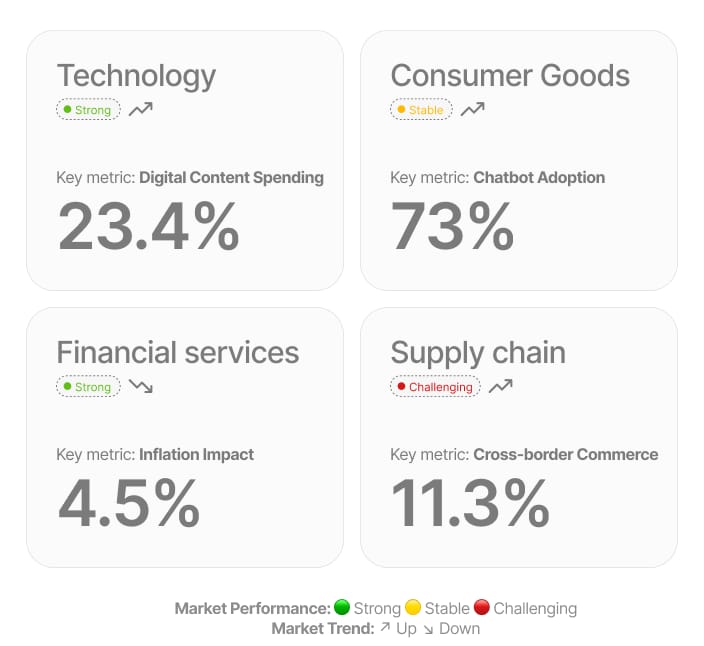 Sector trackerEdition #55
Sector Performance Tracker
Note: This weekly market intelligence dashboard was compiled and analyzed by Rwazi Insights as of Monday, February 24, 2025
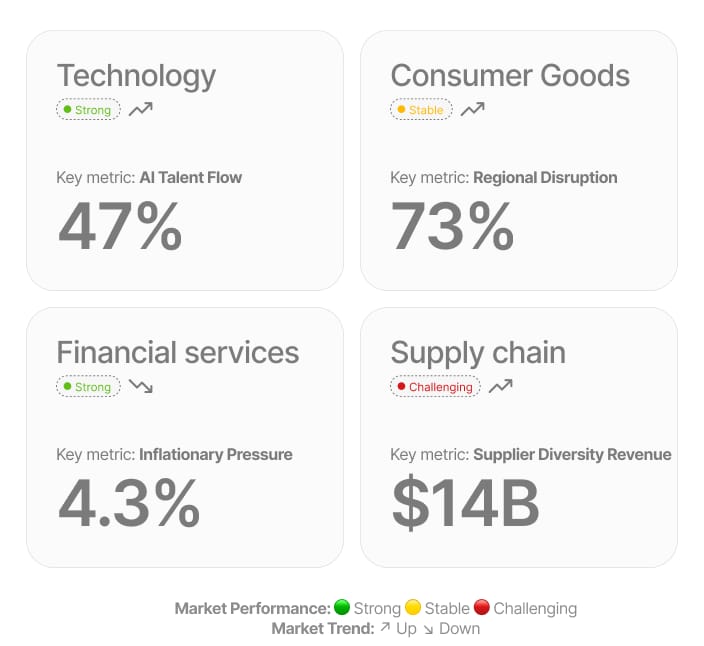 Sector trackerEdition #53
Sector Performance Tracker
Note: This weekly market intelligence dashboard was compiled and analyzed by Rwazi Insights as of Monday, February 10, 2025
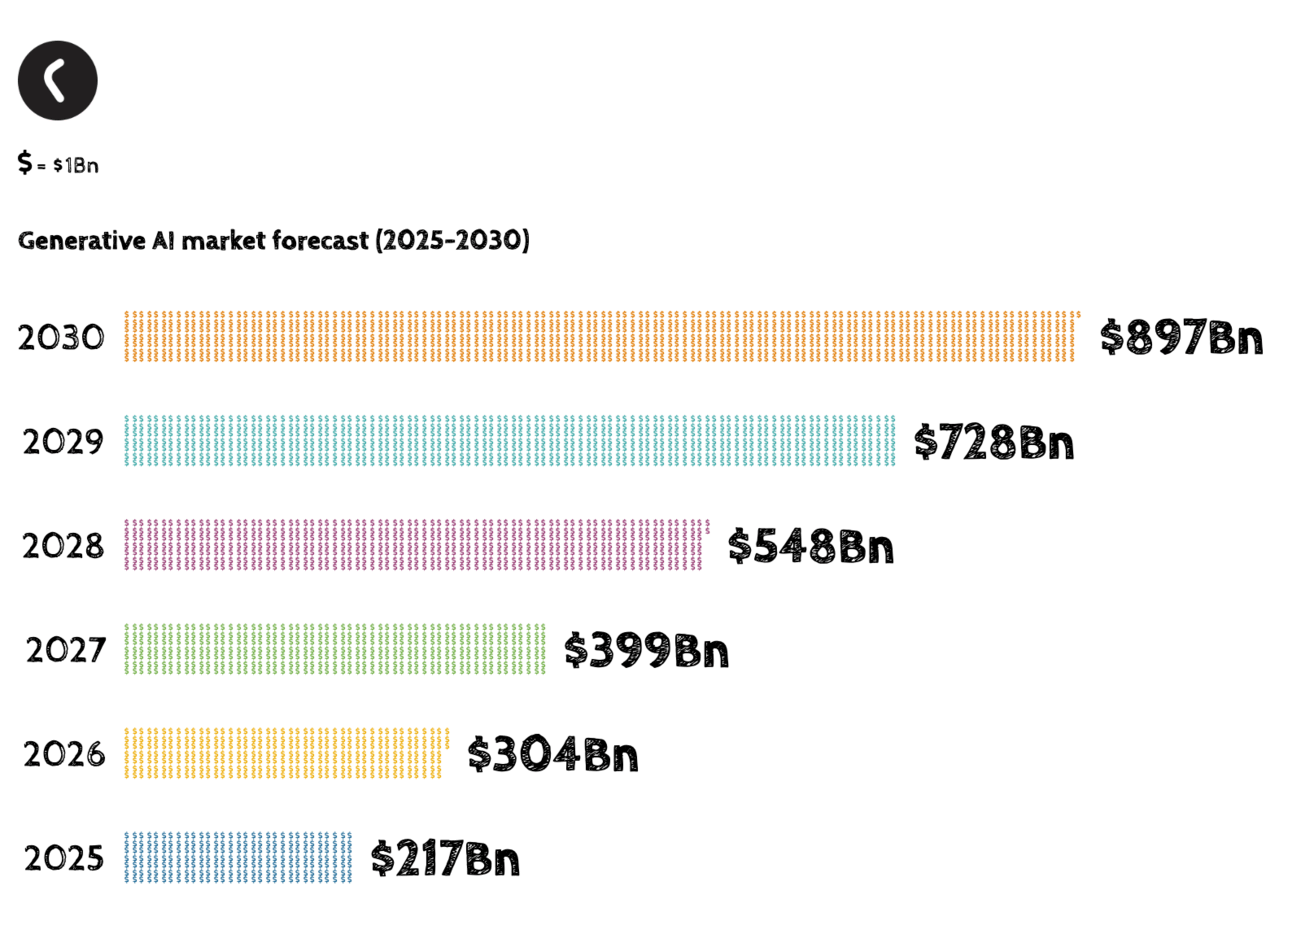 ChartEdition #52
The U.S. tariff tensions averted, but uncertainty lingers
In a last-minute move, the US has postponed the imposition of sweeping 25% tariffs on imports from Mexico and Canada, avoiding a potential trade war with its closest neighbours.
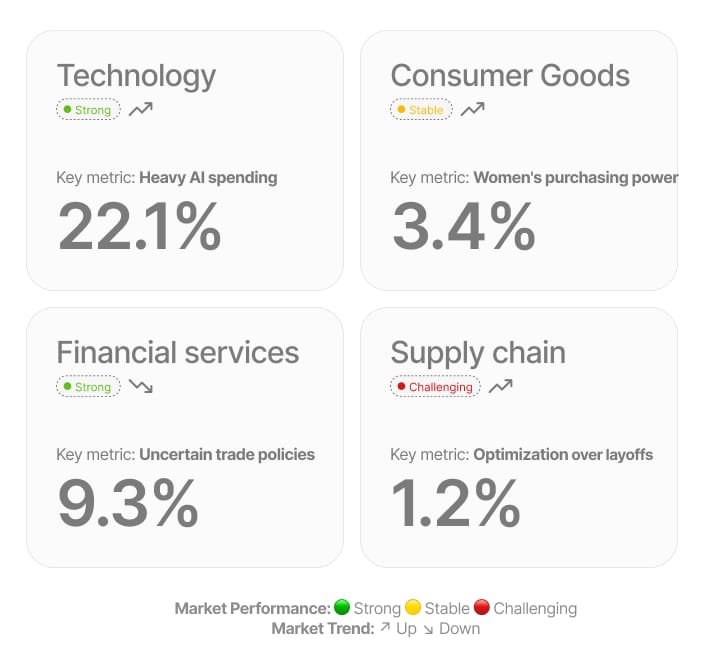 Sector trackerEdition #52
Sector Performance Tracker
Note: This weekly market intelligence dashboard was compiled and analyzed by Rwazi Insights as of Monday, February 3, 2025
 Sector trackerEdition #51
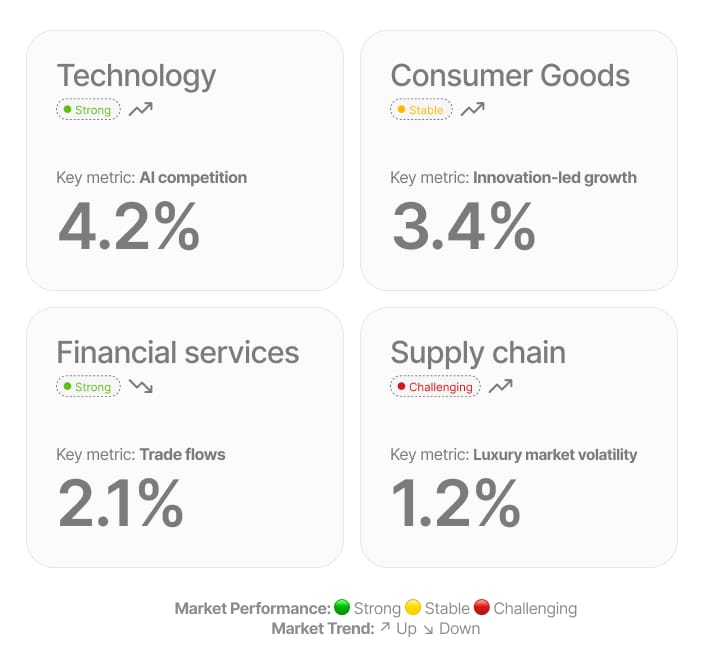
Sector Performance Tracker
Note: This weekly market intelligence dashboard was compiled and analyzed by Rwazi Insights as of Monday, January 27, 2025
 ChartEdition #50
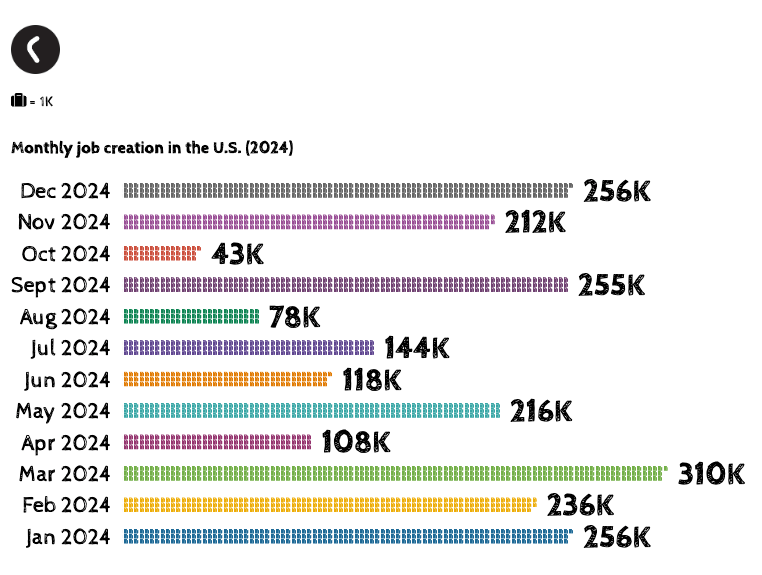
Labour market strength drives consumer confidence
Featured chart: Monthy job creation in the U.S (January 2024 - December 2024). Data: Bureau of Labor Statistics. Analysed by Rwazi Insights
 Sector trackerEdition #50
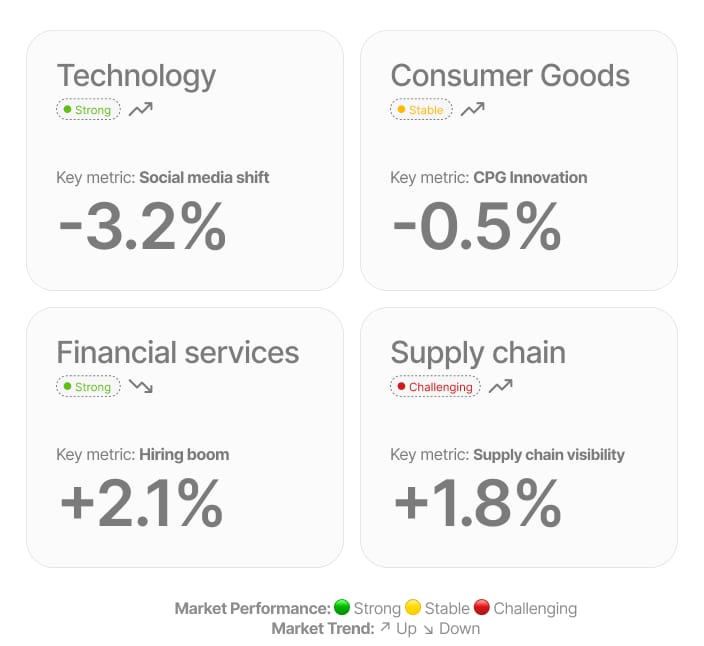
Sector Performance Tracker
This market intelligence dashboard was compiled and analyzed by Rwazi Insights as of Monday, January 20, 2025
 Sector trackerEdition #49
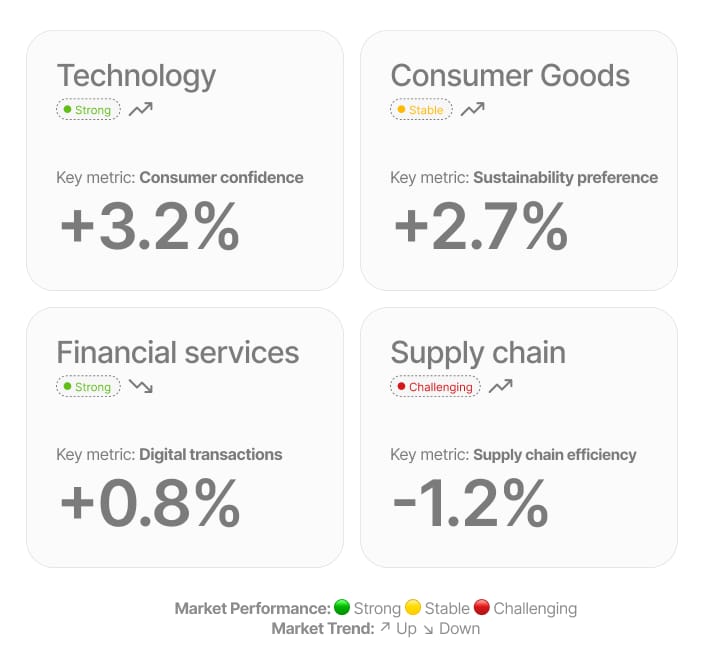
Sector Performance Tracker
This market intelligence dashboard was compiled and analyzed by Rwazi Insights as of Monday, January 21, 2025
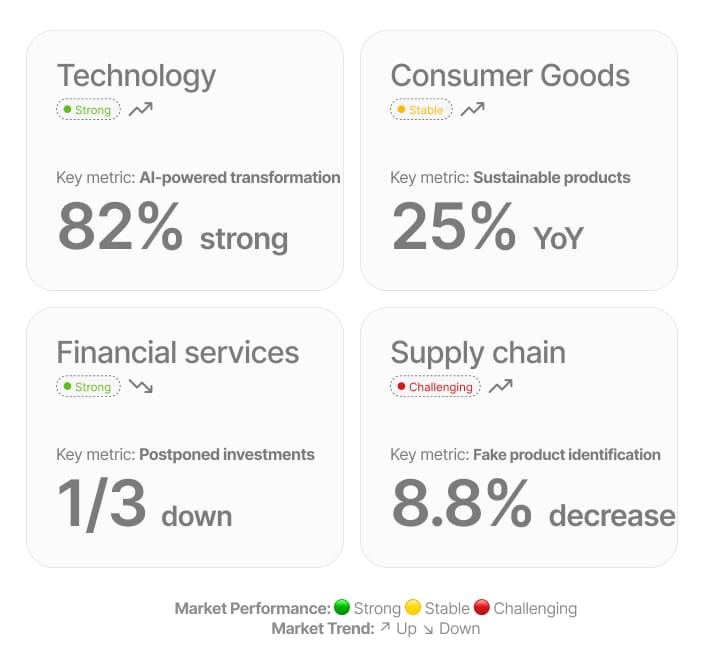 Sector trackerEdition #46
Sector Performance Tracker
Compiled and analyzed by Rwazi Insights as of Monday, December 17, 2024
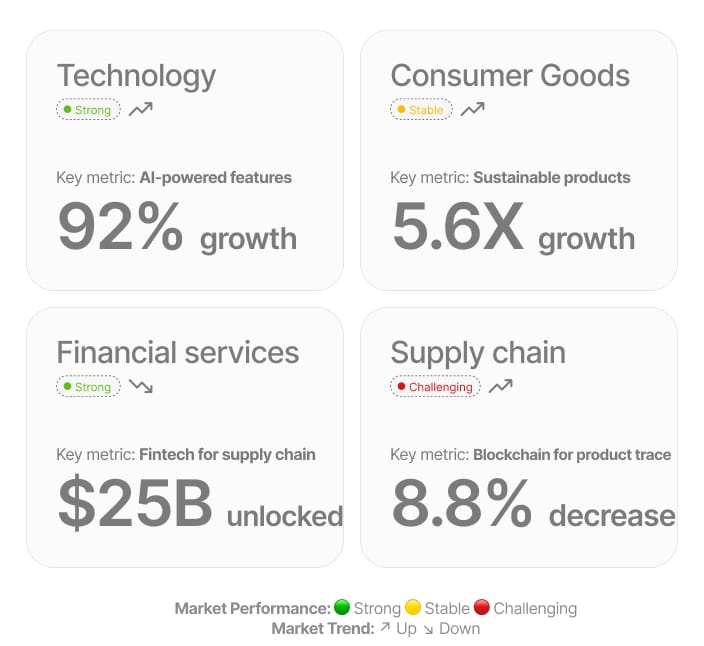 Sector trackerEdition #45
Sector Performance Tracker
Our pulse check on the market is compiled and analyzed by Rwazi Insights as of Monday, December 9, 2024
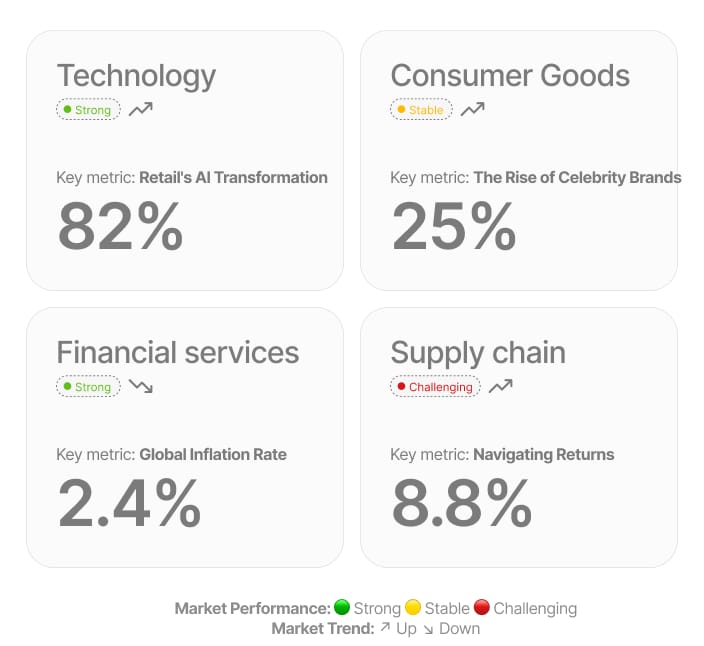 Sector trackerEdition #44
Sector Performance Tracker
Compiled and analyzed by Rwazi Insights as of Monday, December 2, 2024
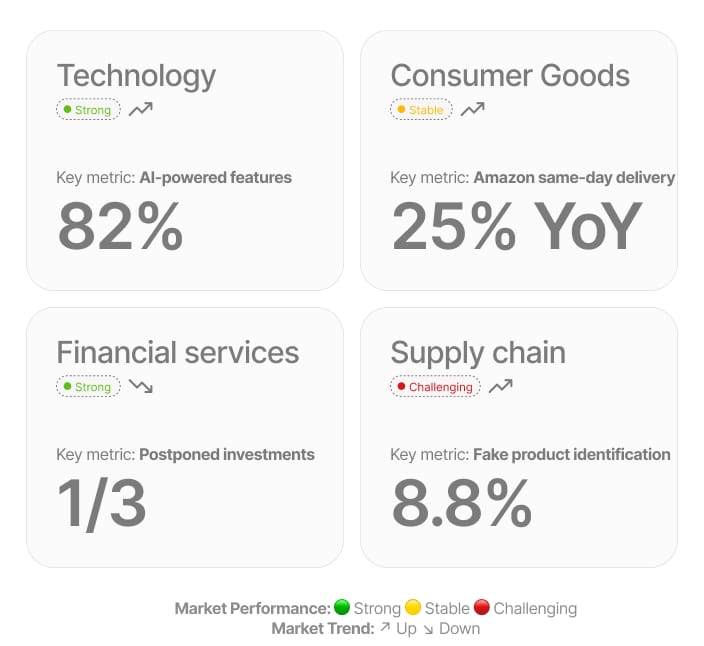 Sector trackerEdition #40
Sector Performance Tracker
Compiled and and analyzed by Rwazi Insights as of Monday, November 4, 2024
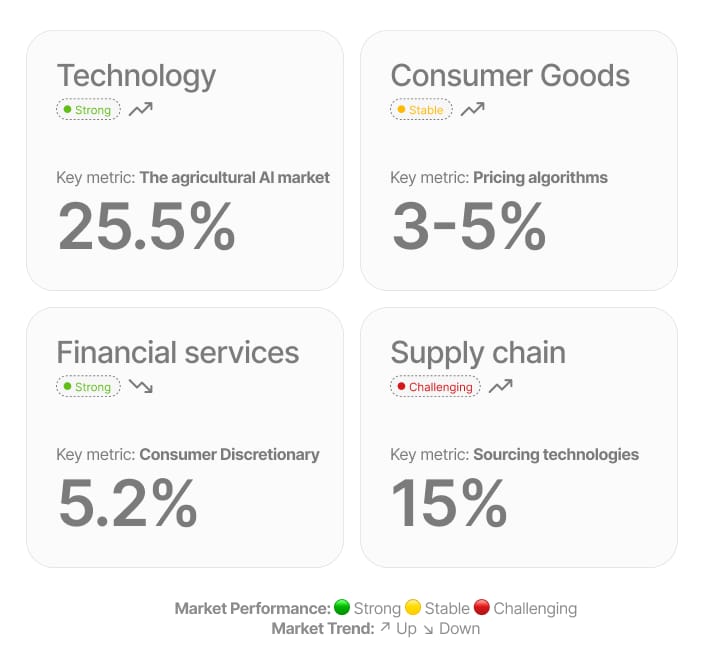 Sector trackerEdition #37
Sector Performance Tracker
Compiled and analyzed by Rwazi Insights as of Monday, October 14th, 2024
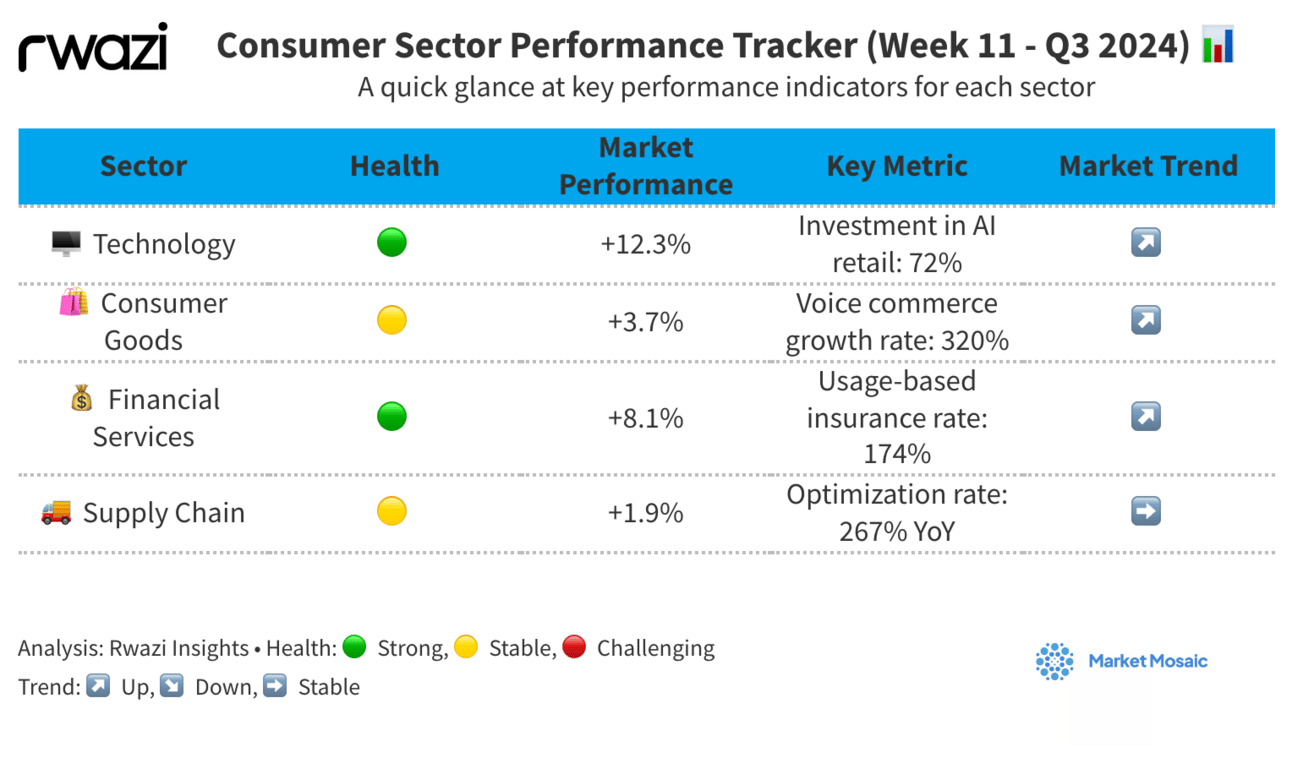 Sector trackerEdition #32
Sector Performance Tracker
The retail sector is undergoing a technological revolution, with emerging technologies at the forefront. Recent data shows that 72% of retailers are investing in AI to enhance customer experiences.
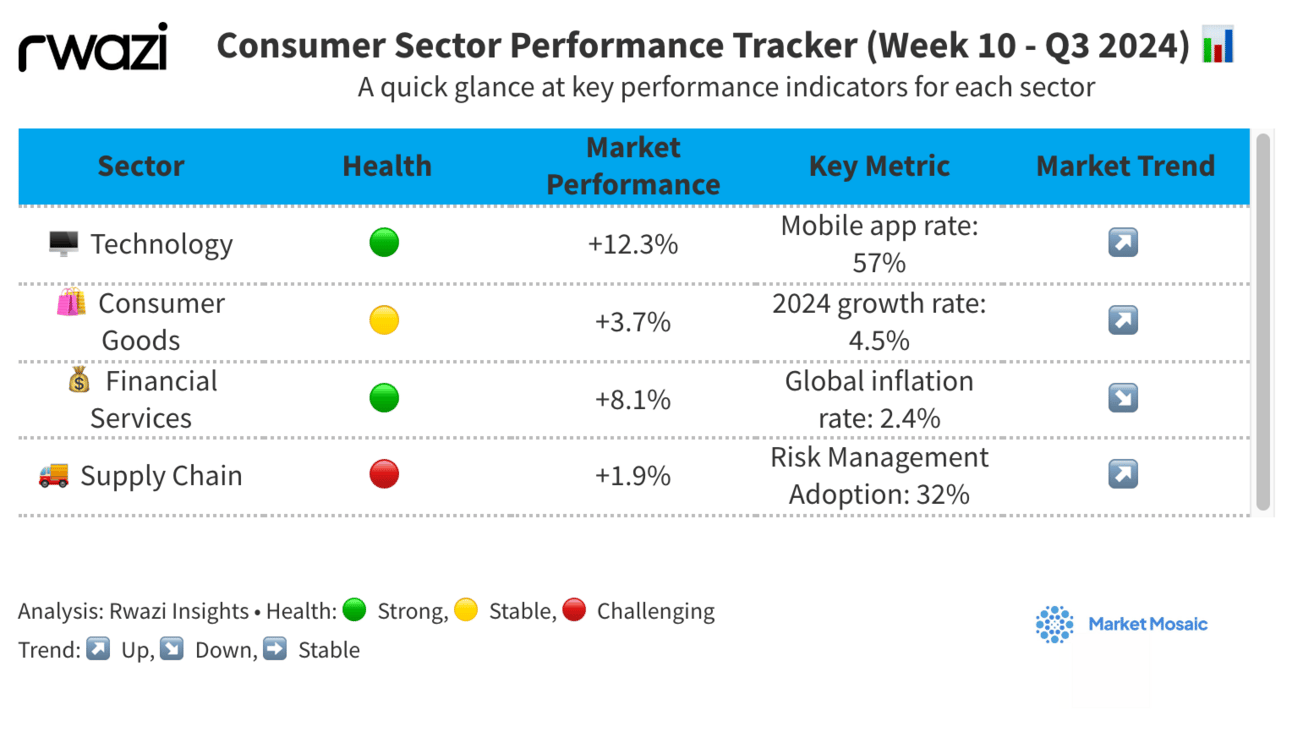 Sector trackerEdition #31
Sector Performance Tracker
Mobile commerce is fast rising at breakneck speed, reshaping how consumers interact with brands and make purchases.
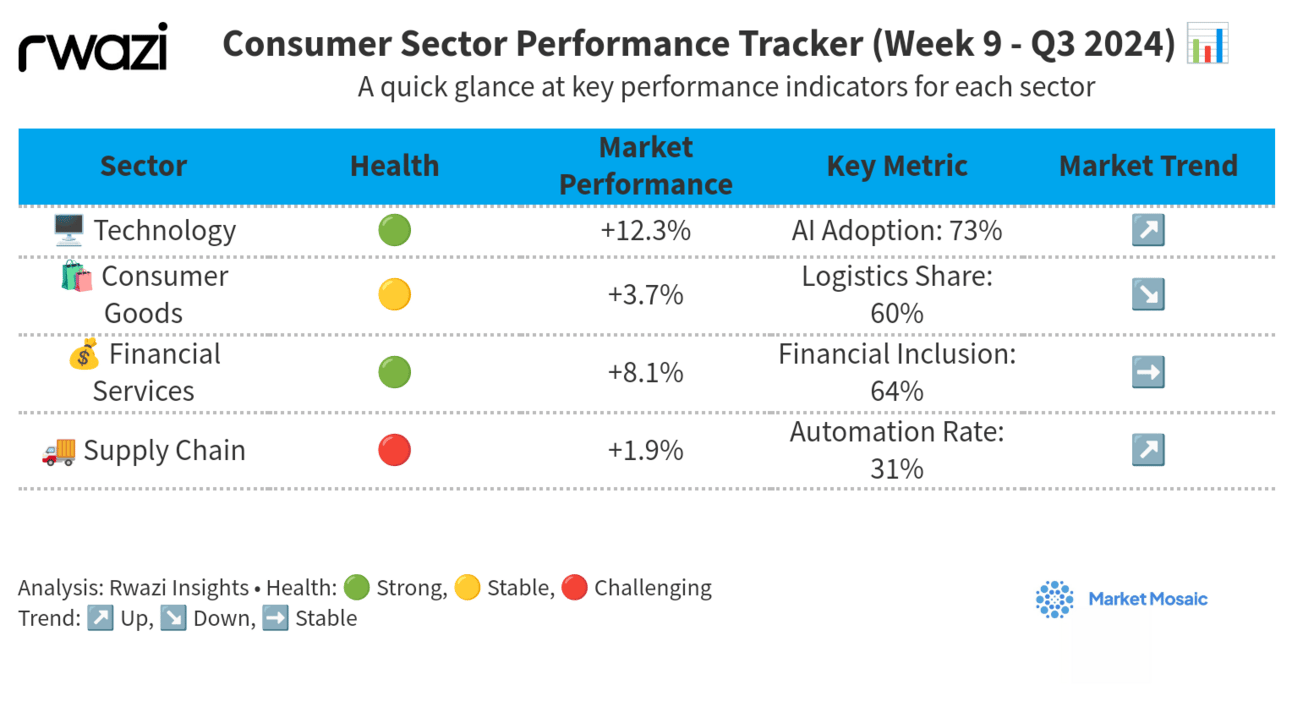 Sector trackerEdition #30
Sector Performance Tracker
We can confirm that the integration of AI in customer service is fast growing than ever, with consumers now increasingly interacting with AI-powered systems.
 Sector trackerEdition #29
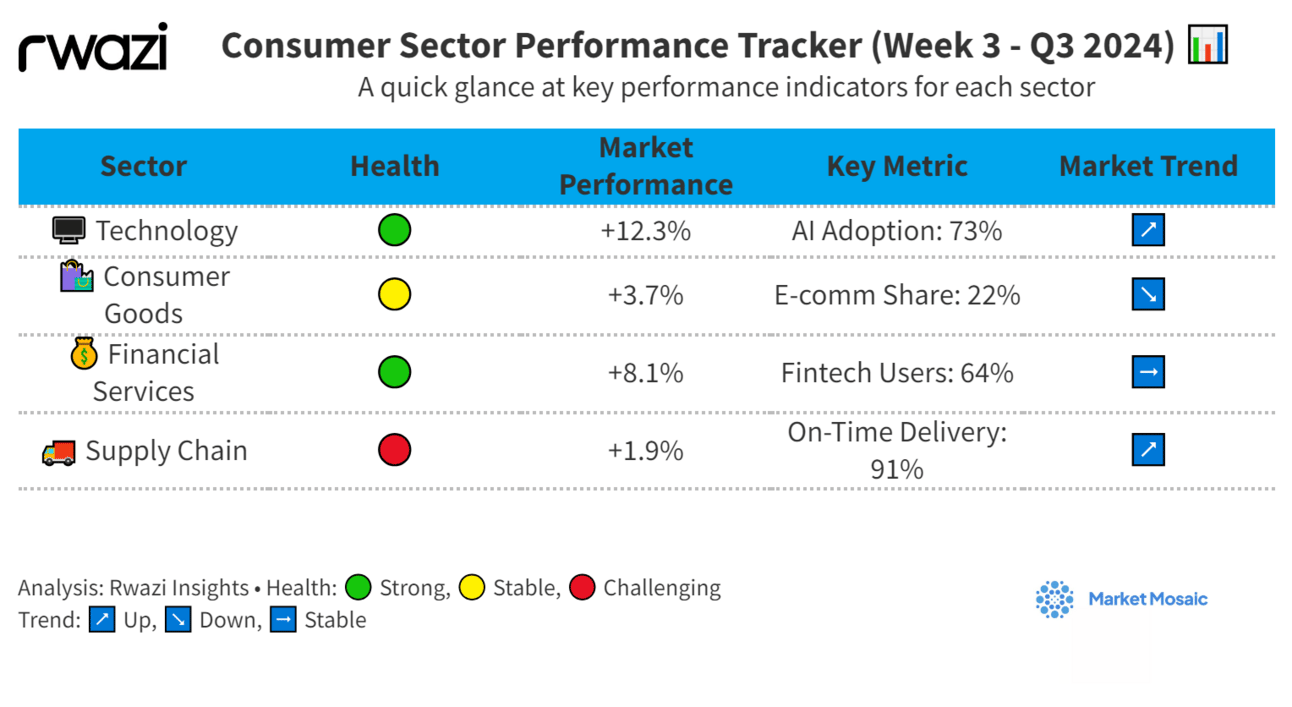
Sector Performance Tracker
As consumer expectations for personalized, on-demand services grow, the healthcare sector is turning to artificial intelligence to deliver more responsive, tailored experiences. Our data analysis shows that 65% of patients are willing to share personal health data if it means receiving more…
 ChartEdition #25
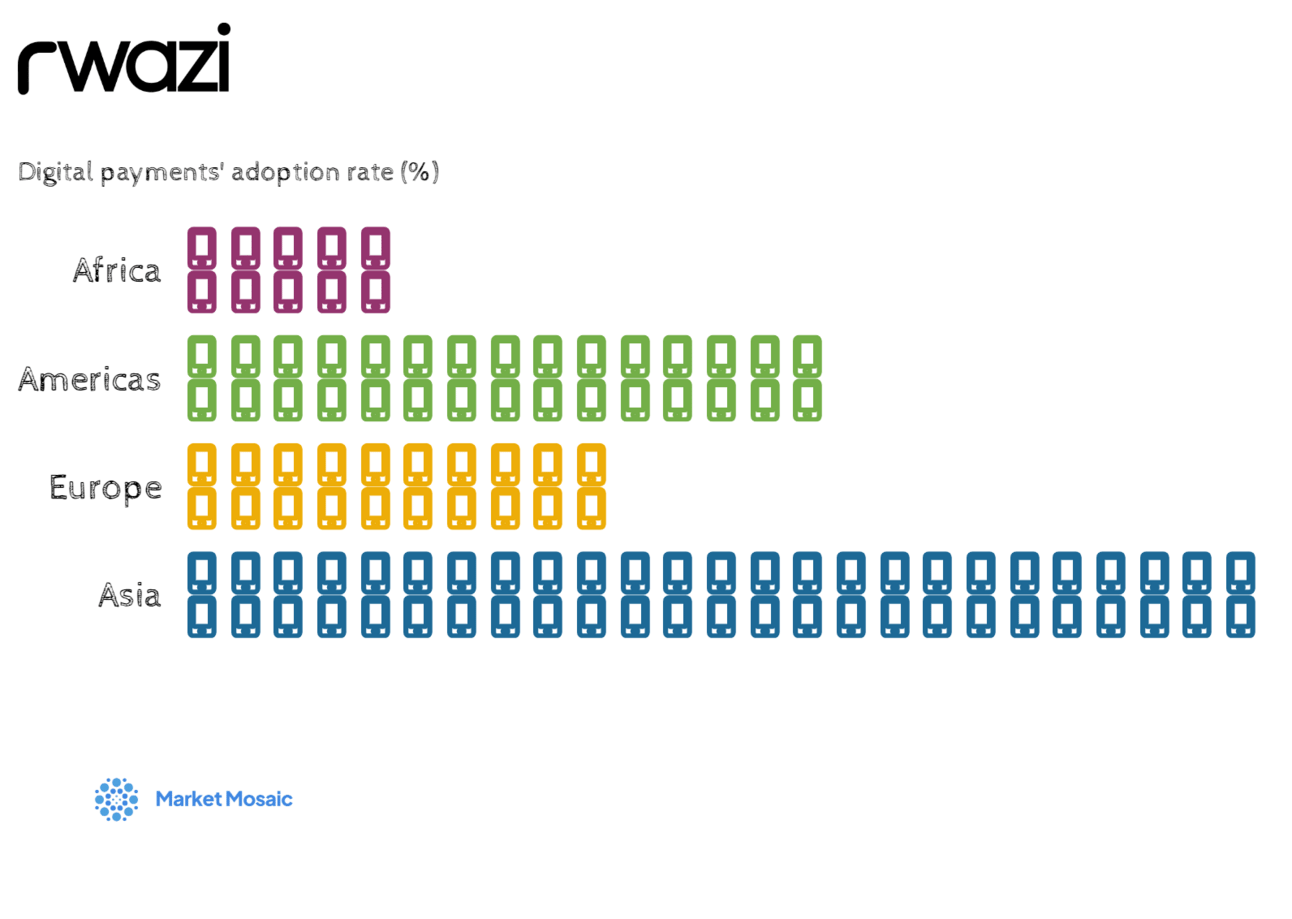
Asia has the world’s highest fintech adoption rate in transaction value
Our data analysis found a fascinating trend: fintech players who successfully integrate with global payment networks see an average 35% increase in transaction volumes. This integration is opening up new possibilities, allowing consumers to use their preferred local payment methods for global…
 ChartEdition #23
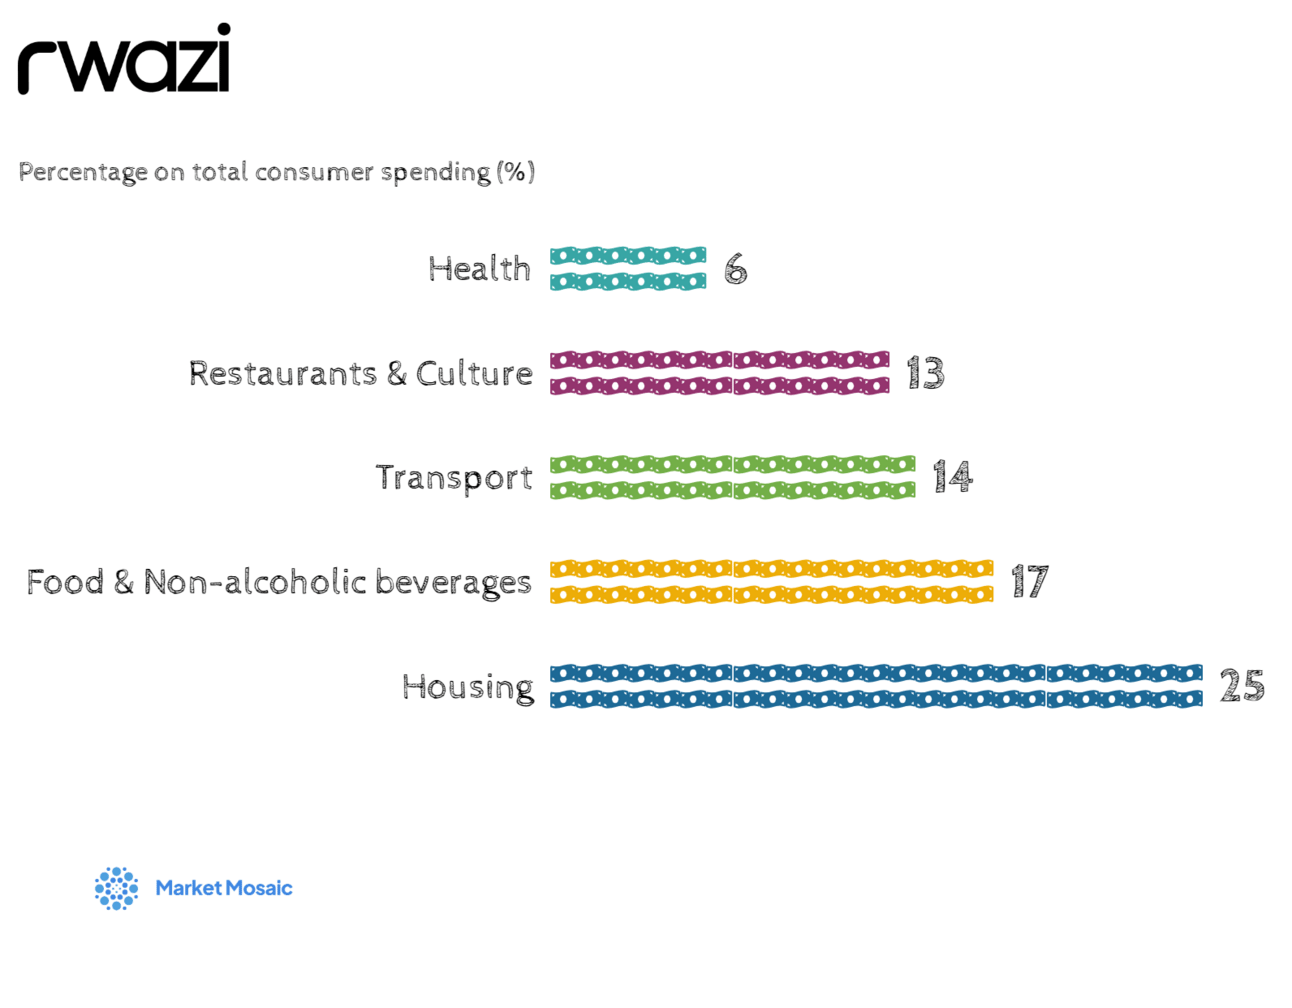
Housing, food top post-inflation consumer spending in H1 2024
As consumers recover from the inflation surge, essentials will account for most expenditures going forward. We predict that housing, food, transportation, restaurants, and healthcare will gobble over 50% of spending in 2024 - reflecting demand for non-discretionary items.
 ChartEdition #22
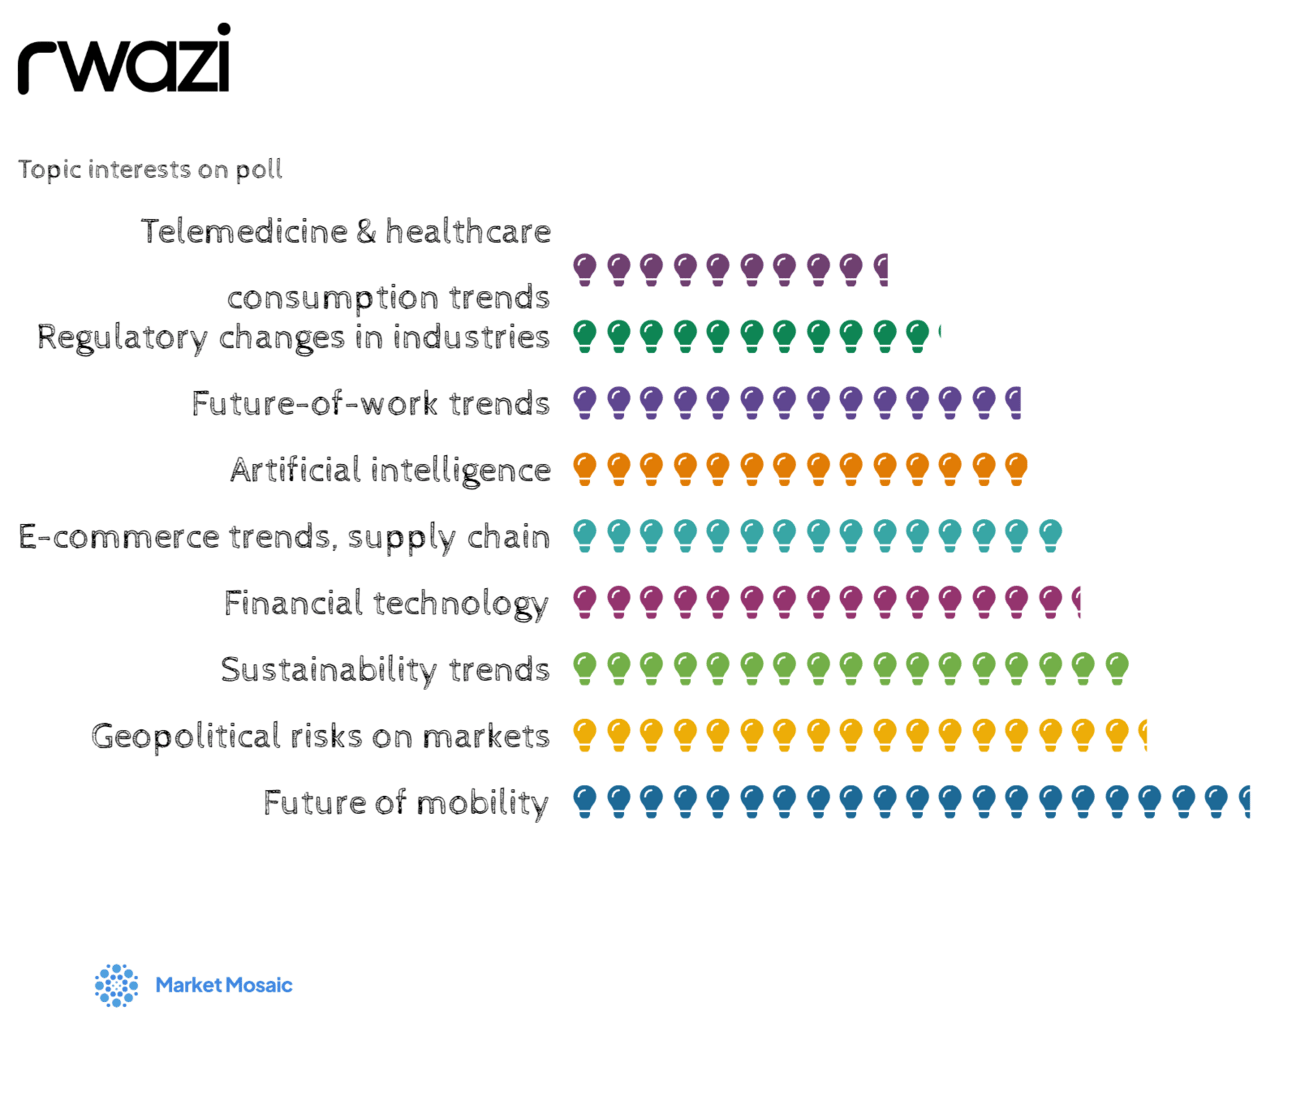
Breakdown of the topic area interests our readers loved via polls
We are now officially halfway through 2024, and if the review of our newsletter open and click-through rates in H1 are any pointers, we are happy to share that our readers really loved these editions. Here you have a midyear look at our top 10 most-read editions of the year to date:
 ChartEdition #19
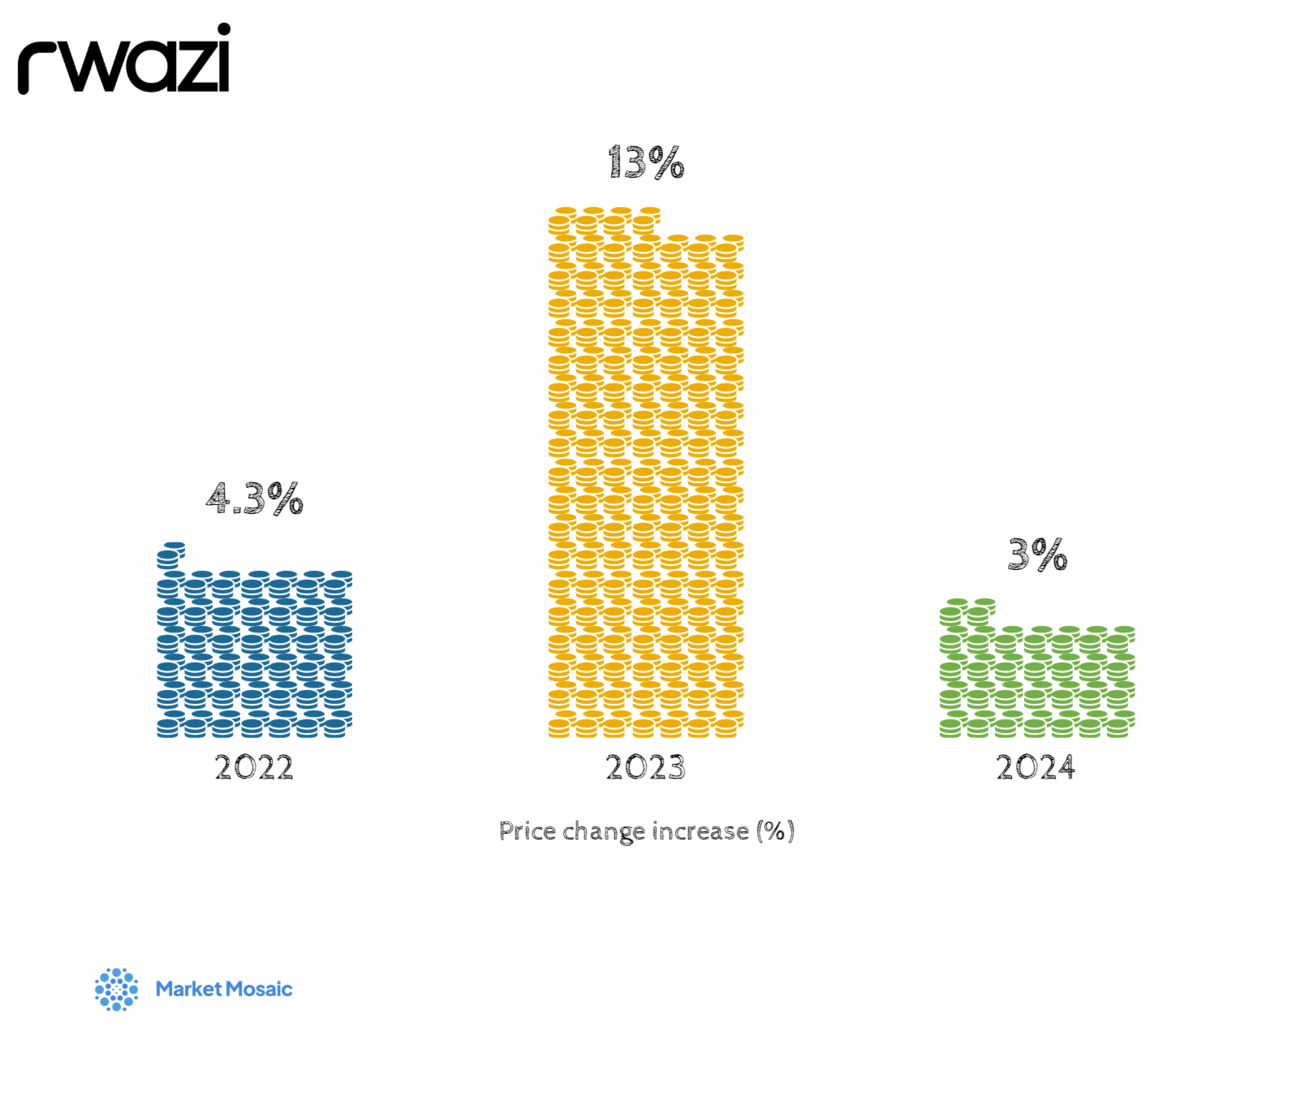
At a low consumer price increase of 3%, global FMCG inflation will be felt in 2024
The next 12-18 months present a mixed outlook for the global retail industry as consumer spending power wavers. Our latest data analysis also points to adjusted Earnings Before Interest and Taxes (EBIT) growth of just 1-3% for physical retailers during this period.
 ChartEdition #18
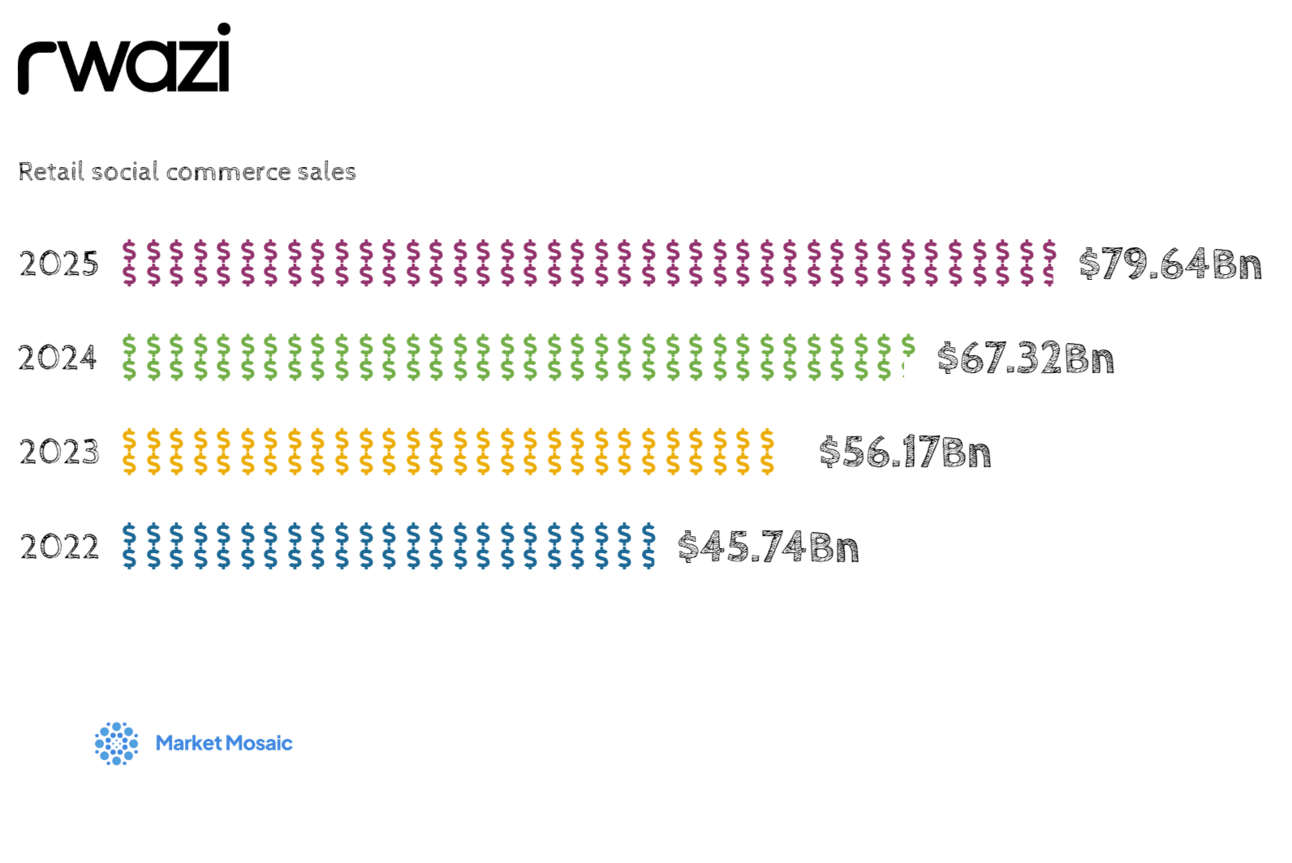
Retail social sales from 2022 to 2025 (in USD billions)
Historically, social media creators received brand payouts primarily for access to their audience. However, as the influencer economy has exploded, the value model is shifting — creators themselves are becoming the prize.
 ChartEdition #17
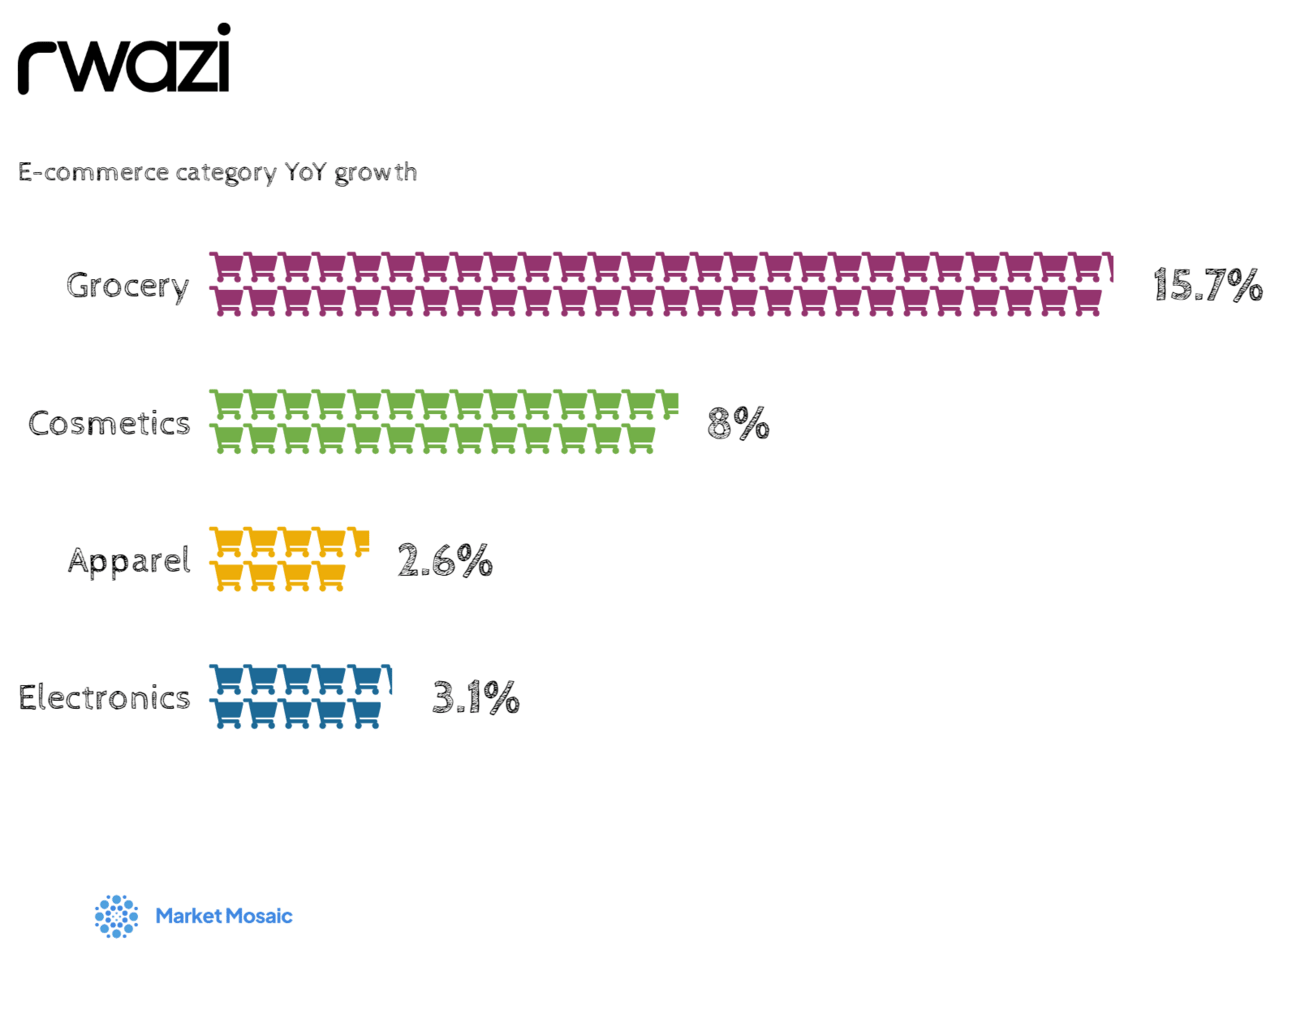
Grocery leads in the year-over-year (YoY) e-commerce growth (Q1 2024)
E-commerce categories see strong YoY growth in Q1 2024, with Grocery leading the pack at 15.7% - Data analysis: Rwazi Insights
 ChartEdition #16
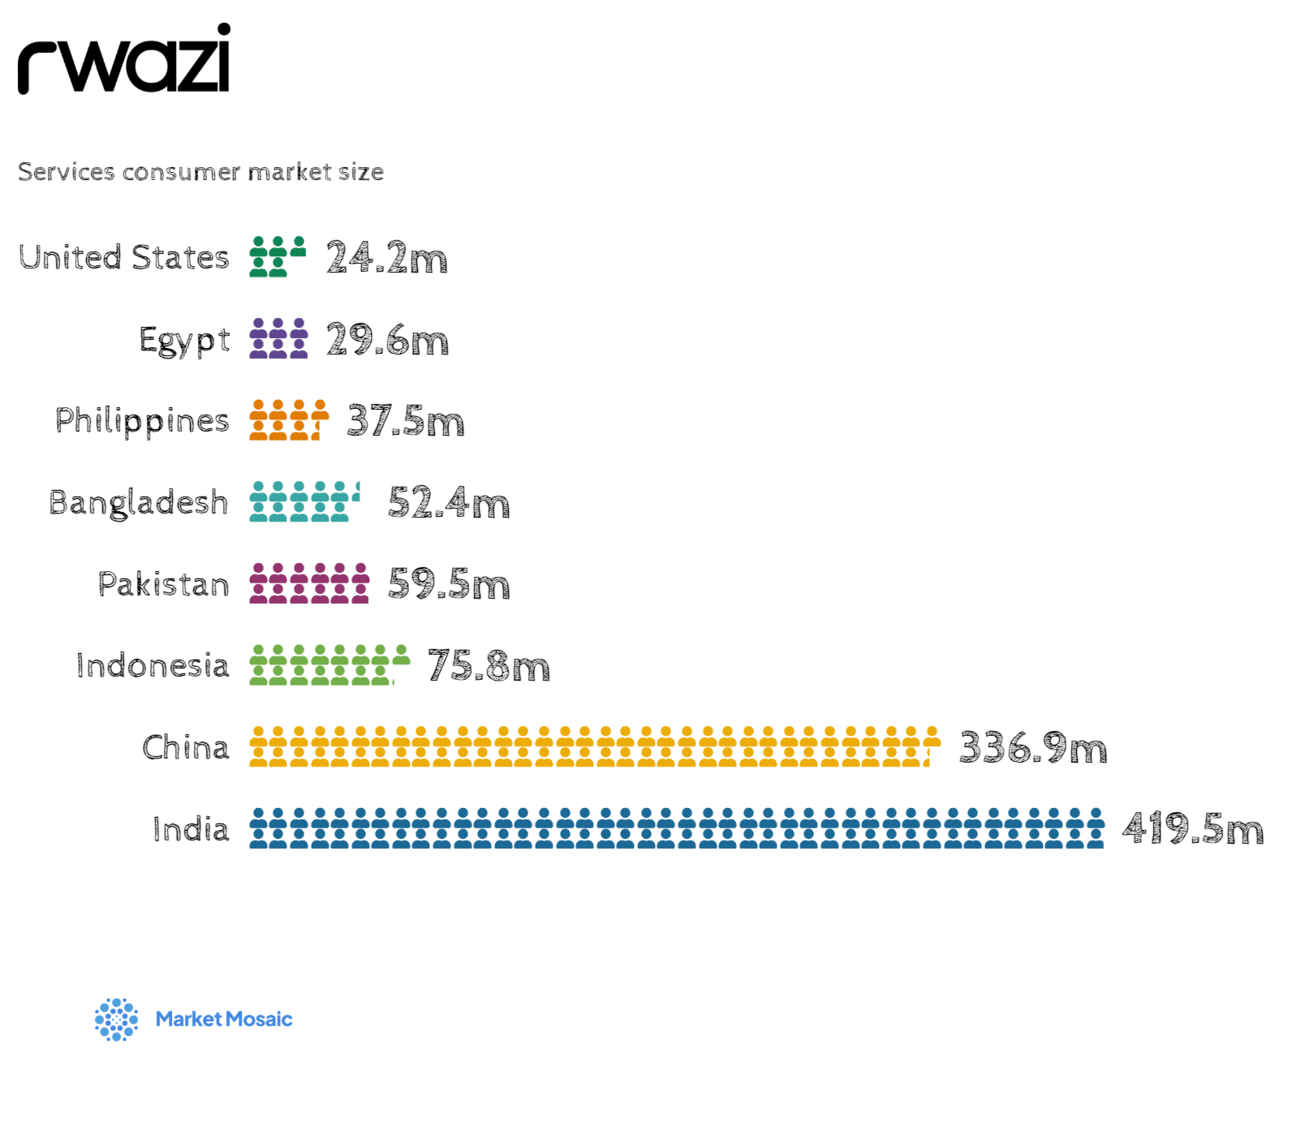
The fastest-growing services consumer market size in the world
The convergence of physical and digital channels has become the norm rather than the exception. Analysis of curated data found that 73% now leverage multiple touchpoints to discover, compare, purchase, and receive products and services.
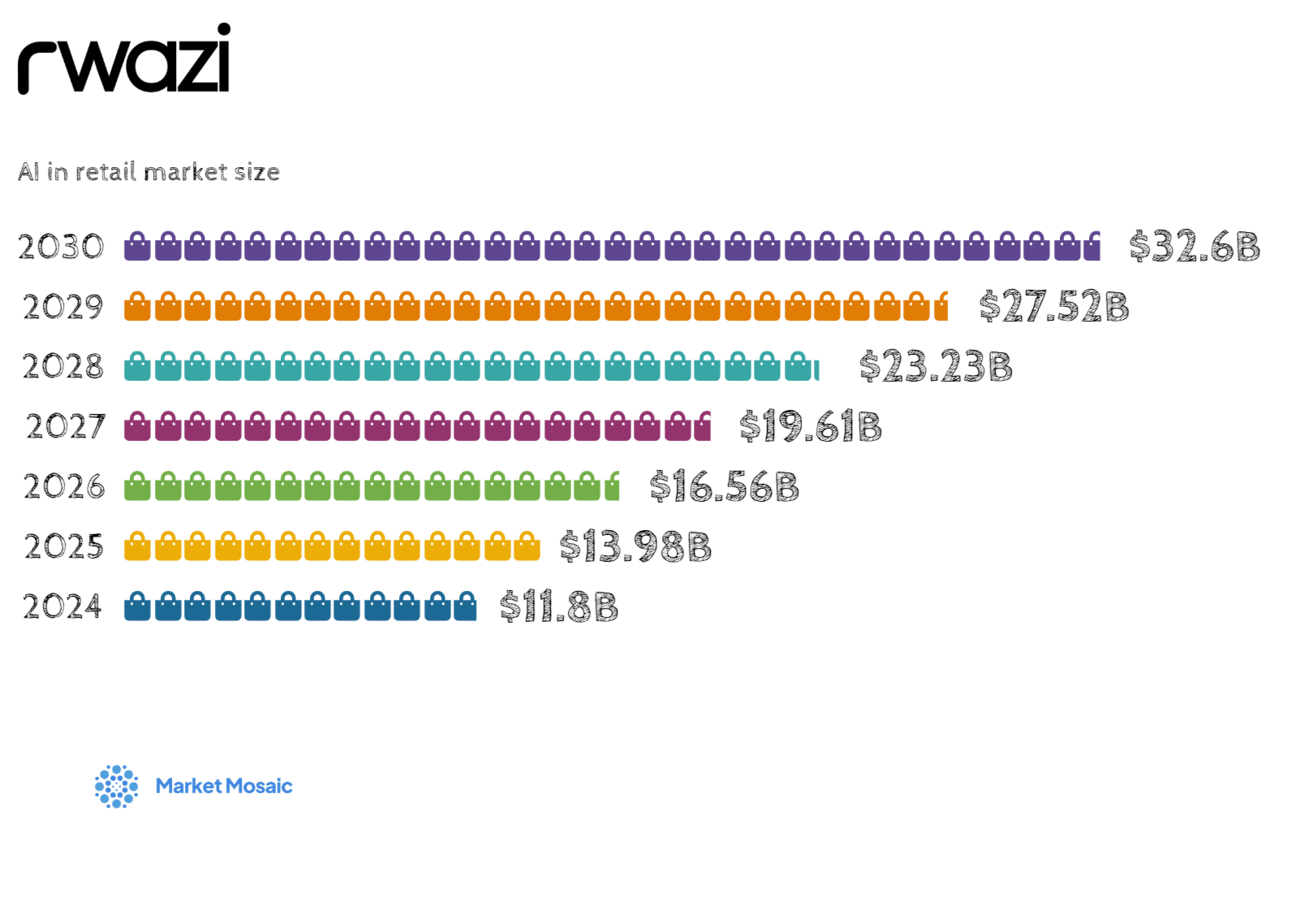 ChartEdition #15
Artificial intelligence (AI0 in retail market size (2024-2030)
Global AI in retail market size is projected to hit close to $32.6 billion by 2030 at a compound annual growth rate of 18.45% during the forecast period .• Data analysis: Rwazi Insights
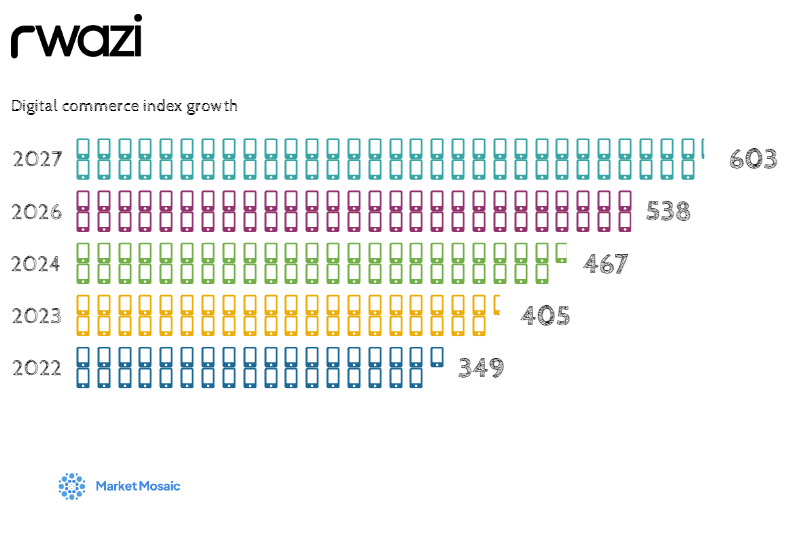 ChartEdition #14
Digital Commerce Index growth for rising markets (2023-2027)
A new breed of "shoppertainment" platforms is also g aining significant traction , blending entertainment, influencer marketing, and direct sales into an immersive live-streaming experience:
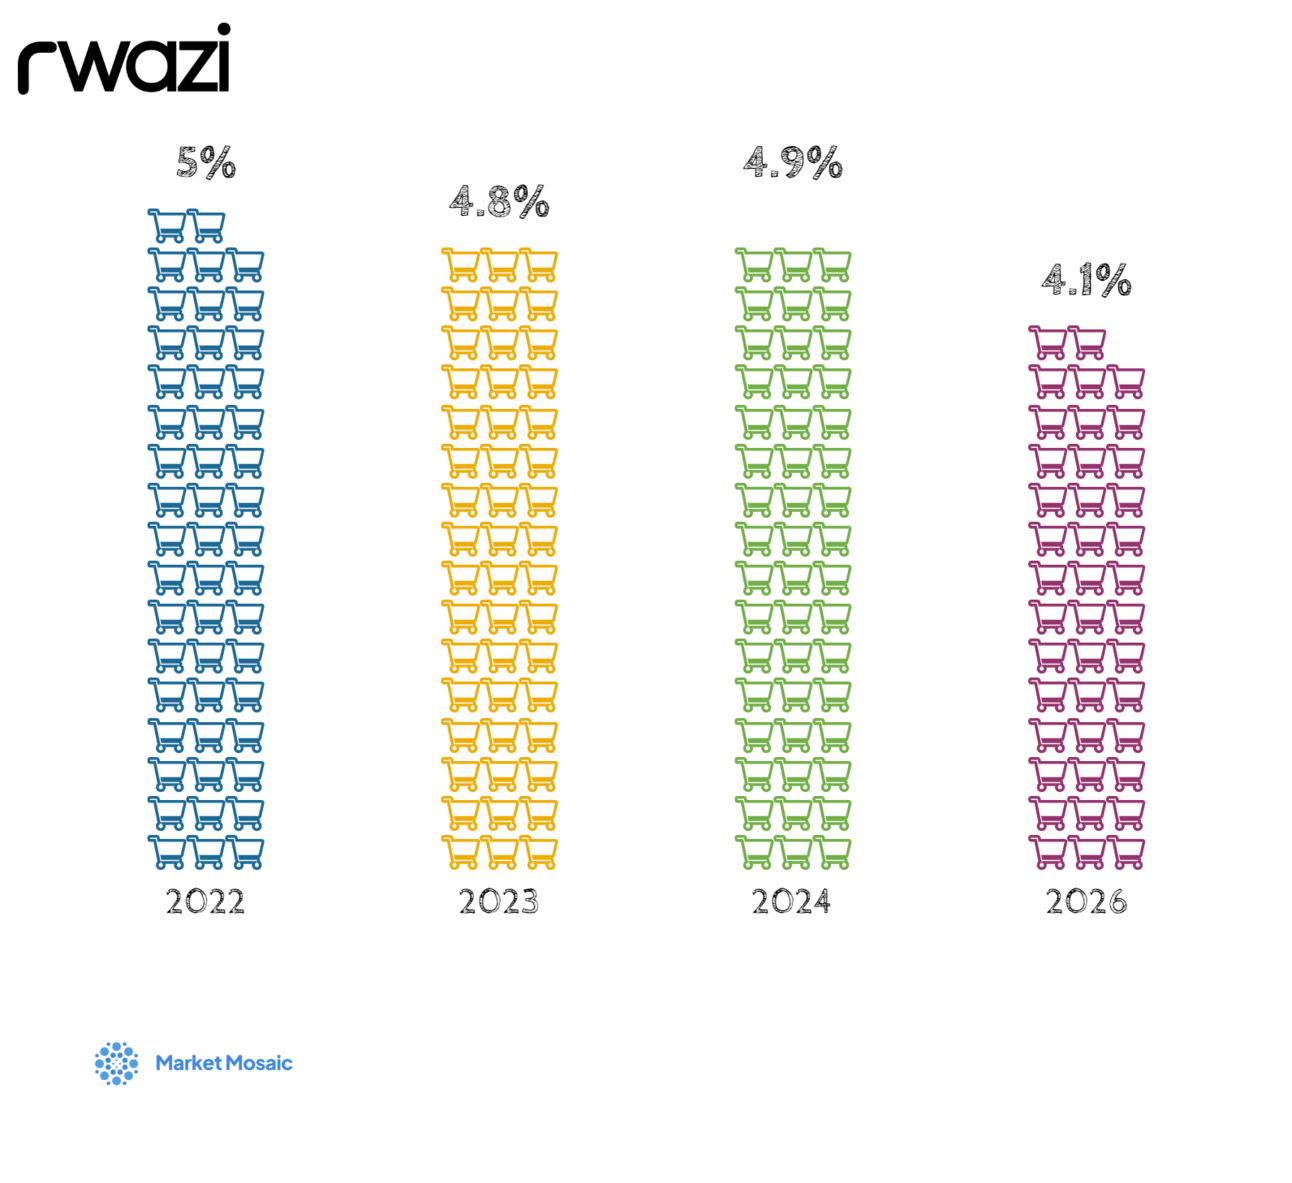 ChartEdition #13
Projected retail sales growth rates worldwide (2022-2025)
While above-ground innovations are transforming retail logistics, a new frontier is also emerging underground. Startups are pioneering autonomous robot delivery systems integrated into smart city infrastructure:
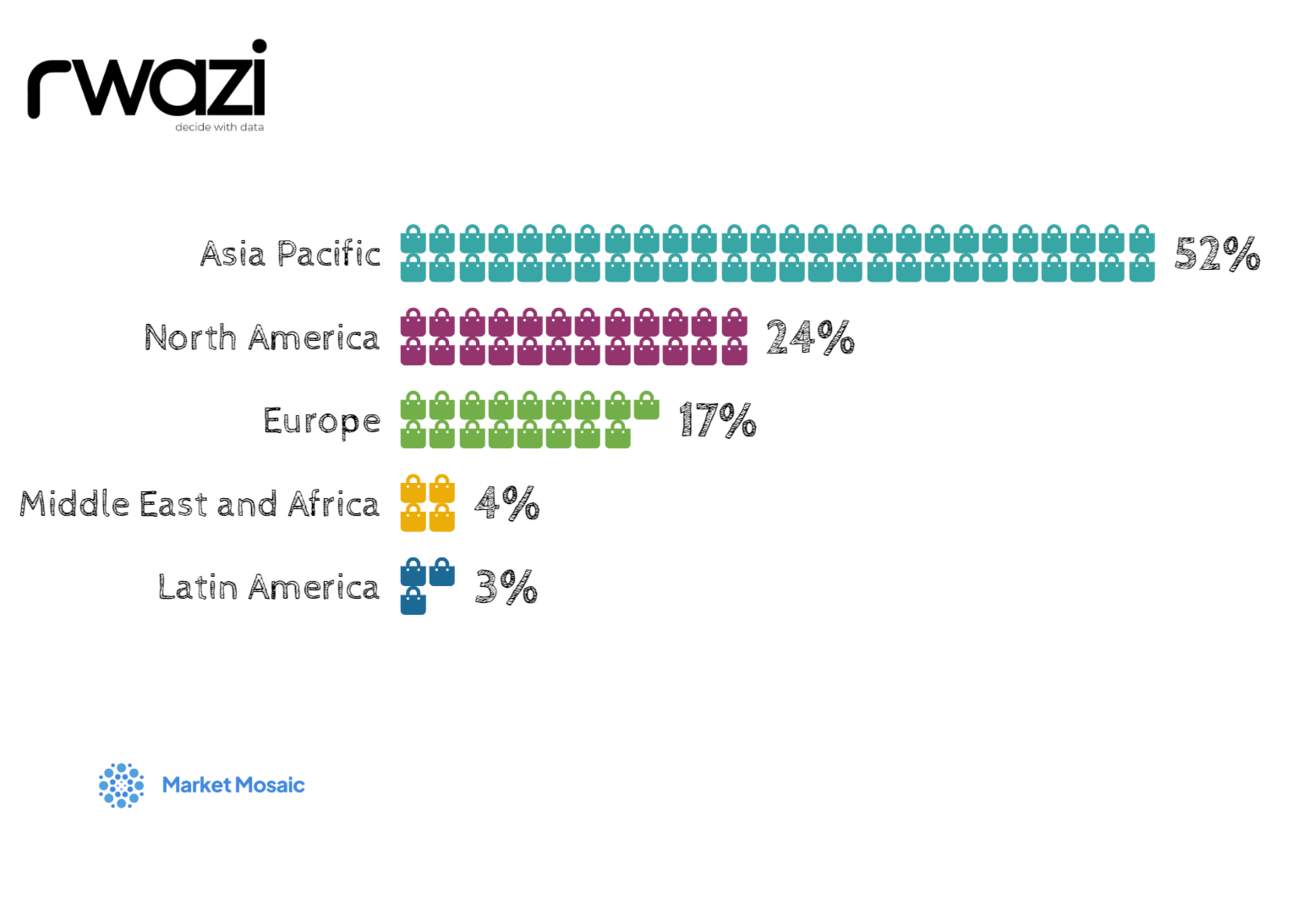 ChartEdition #12
Asia Pacific has the fastest growth rate in reverse logistics at 52% market share
Reverse logistics market share by region (as of 2023) • Data analysis: Rwazi
 ChartEdition #11
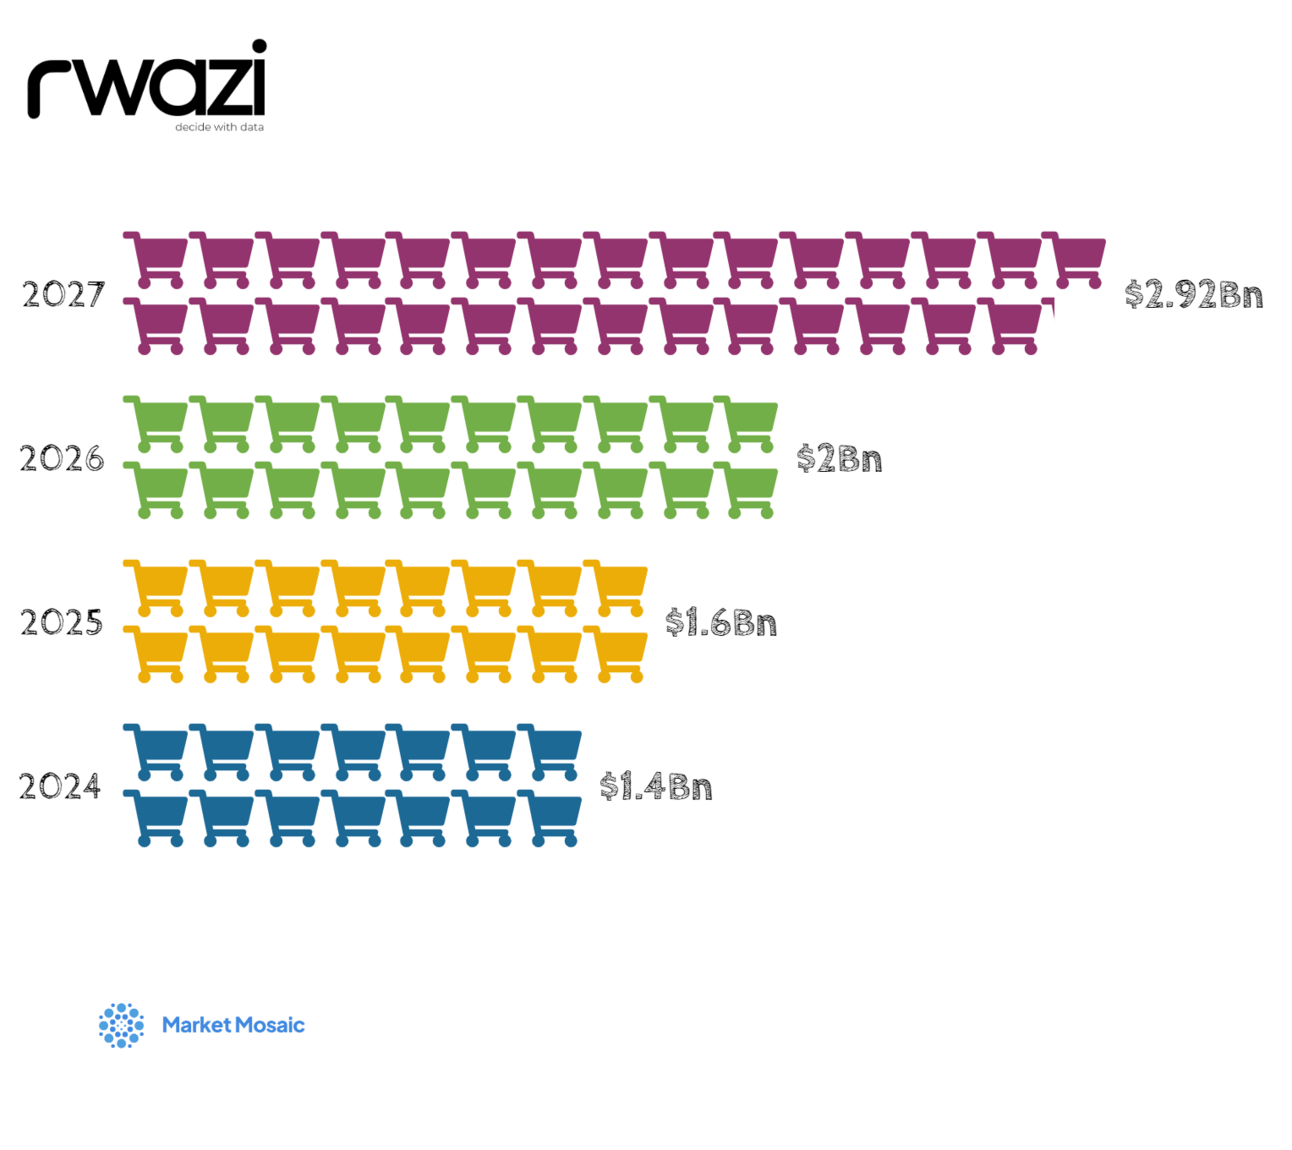
Projected global supply chain finance market size (2024-2027)
By becoming a contributor, you will share your unique perspectives with our engaged audience of industry leaders, establish thought leadership, access Rwazi's data, and collaborate with our analysts. Are you interested? Kindly fill out the interest form here .
 ChartEdition #10
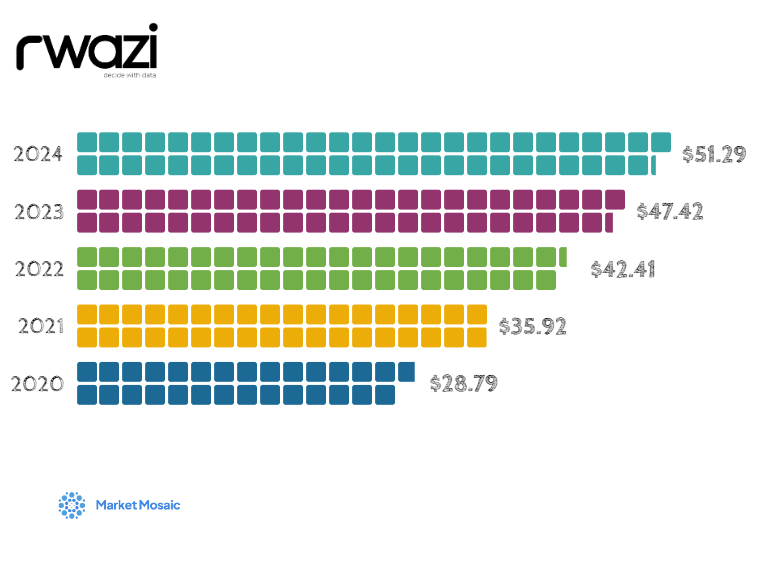
Historical and projected global oil prices since 2020
While international oil majors have led early digital transformation efforts, national oil companies (NOCs) are prioritizing significant data initiatives as a competitive necessity:
 ChartEdition #9
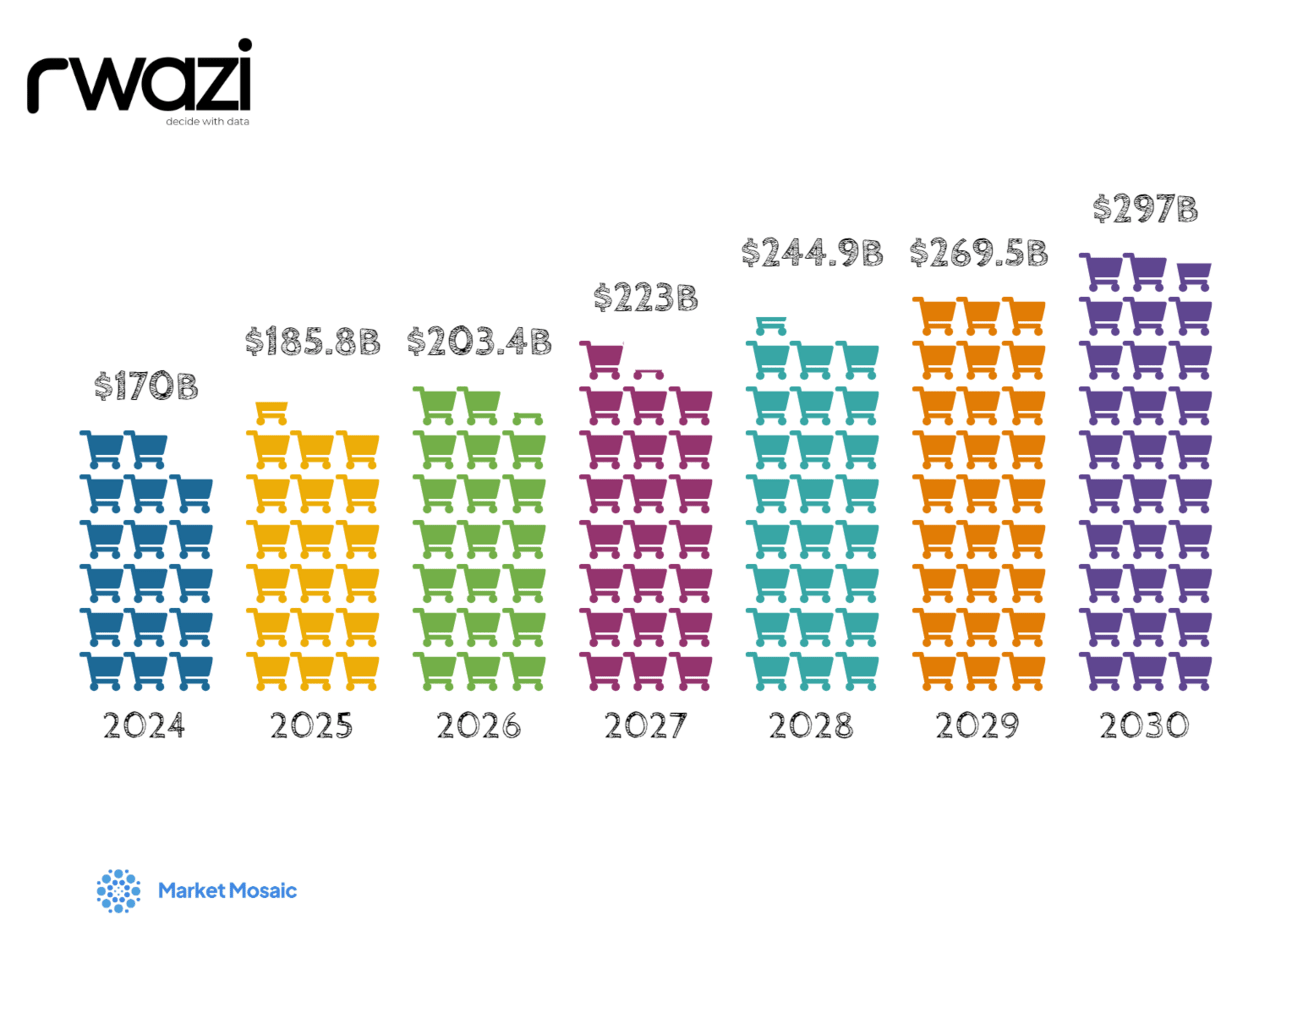
Last mile delivery market size: From $170B to $297B (2024-2030 forecast)
Traditional hub-and-spoke parcel delivery networks are proving ineffective in rapidly urbanizing areas with higher household densities. A new breed of startups is deploying innovative micro-mobility and crowdsourced models tailored for cities:
 ChartEdition #8
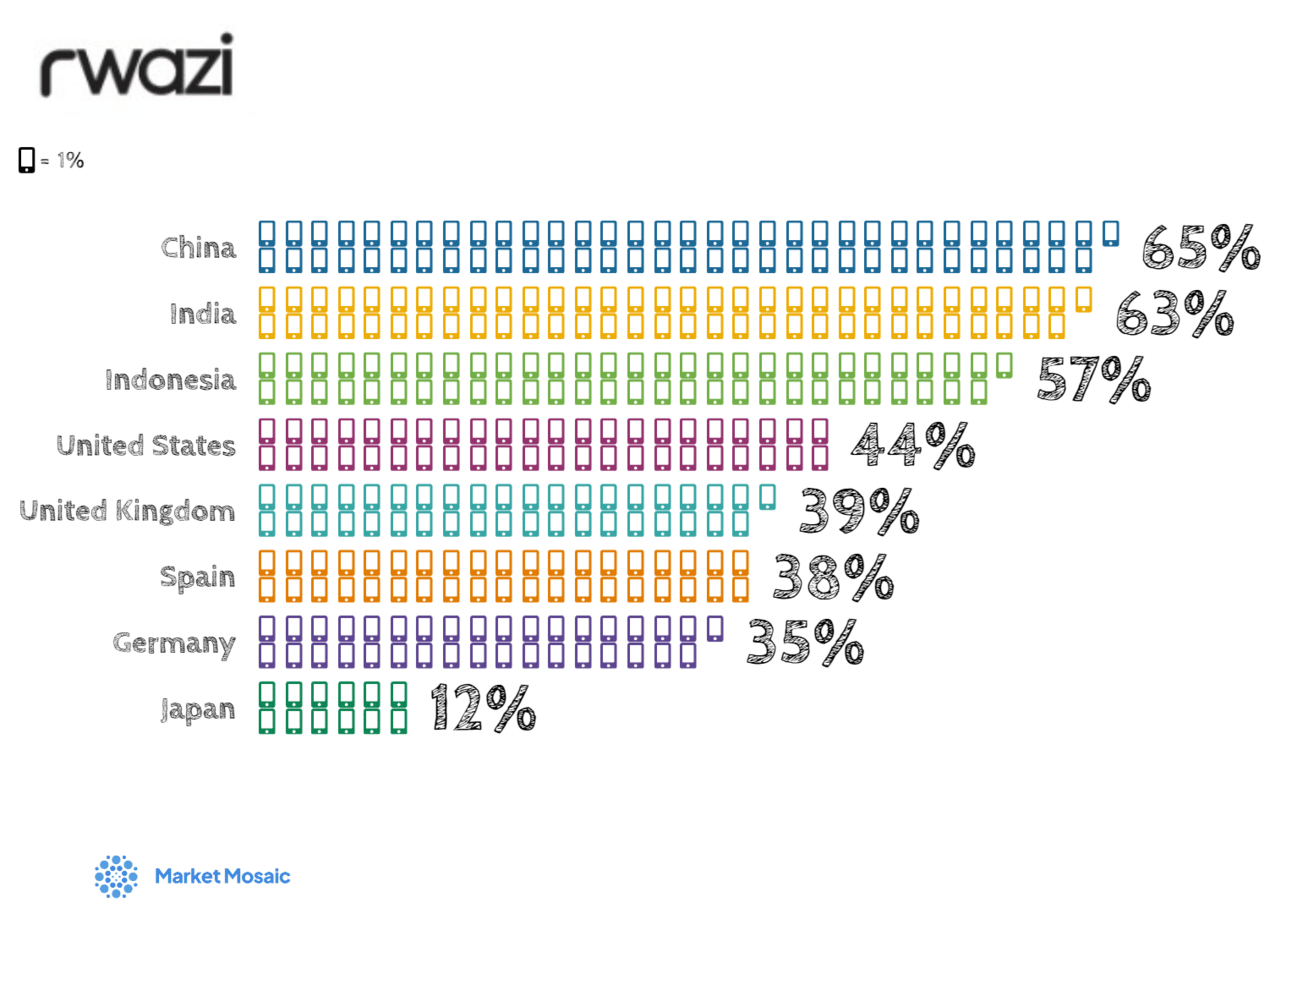
Emerging markets outpacing developed nations in health app adoption 📱
Where health apps are most commonly used around the world • Source: Statista Global Consumer Survey • Data analysis: Rwazi Insights
 ChartEdition #7
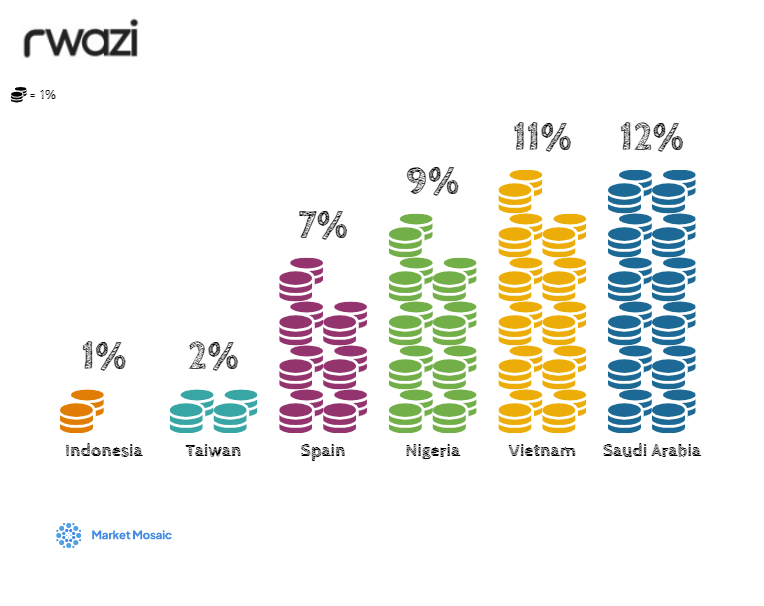
Top countries by year-over-year growth in crypto transaction volumes
The Buy Now Pay Later (BNPL) industry is upending how consumers access financing and pay for purchases. Led by innovators like Affirm, Afterpay, and Klarna, BNPL startups have rapidly penetrated e-commerce checkout flows and mobile payment journeys.
 ChartEdition #6
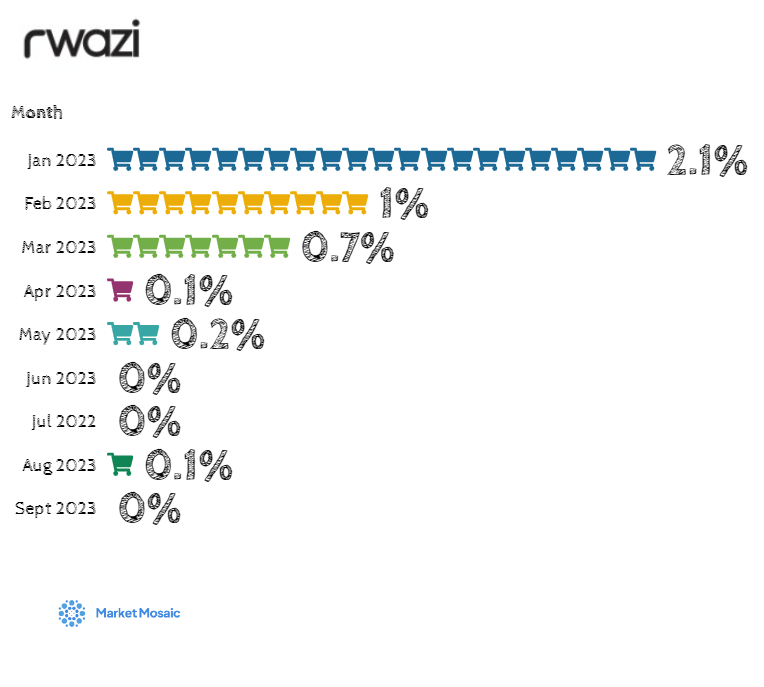
Downward year-on-year change in China's Consumer Price Index (%)
As growth fundamentals soften in China, companies must rebalance their portfolios toward markets with more favourable consumer trajectories. Several regions appear poised to emerge as new spending powerhouses:
 ChartEdition #5
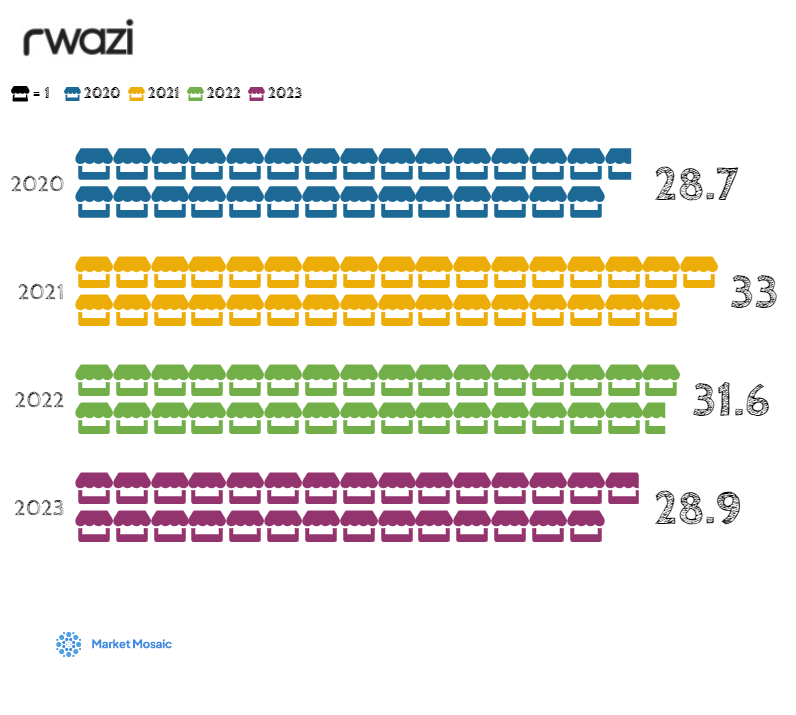
U.S. Import volumes return to normal in 2023 (millions of 20-foot equivalent units)
With stability and geographic clustering trumping offshoring's cost savings, we predict domestic manufacturing will rise 22% in high-tech industries like pharmaceuticals and nearshore regions, attracting up to $900 billion in relocated production through 2025. This reshoring narrative is playing…
 ChartEdition #4
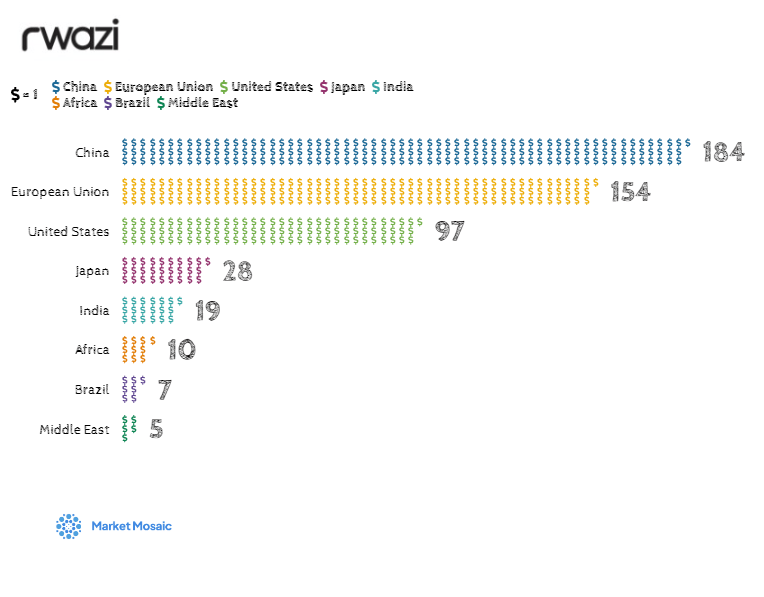
China, United States attracted the highest clean energy investment volumes
Over 50% of global oil consumption comes from road transportation like passenger vehicles and trucks. Aviation accounts for another 8%. With the growth of alternate mobility options like EVs and falling costs, oil demand for transport could drop by 30% by 2030, according to Rwazi consumer analysis.
 ChartEdition #3
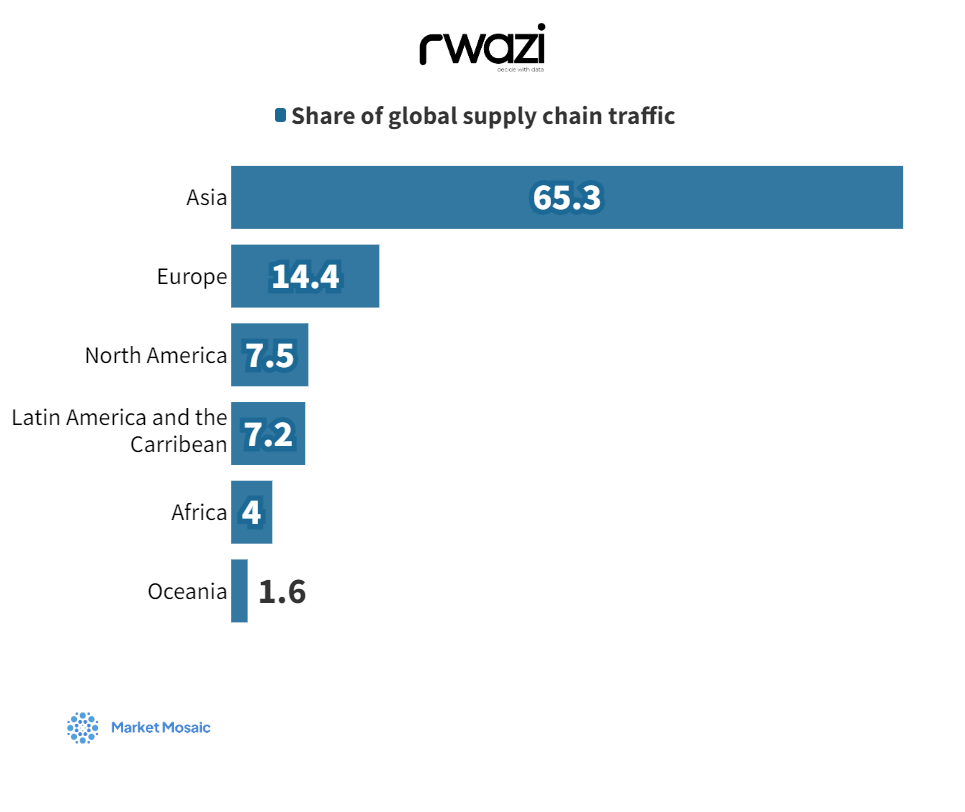
YoY growth rates for key supply chain tech categories
The logistics and supply chain ecosystem, particularly in emerging economies, is transforming amid technology growth and infrastructure challenges like fragmented markets, poor infrastructure, and complex regulations that drive up costs. Smaller fragmented players have traditionally dominated…
 ChartEdition #1
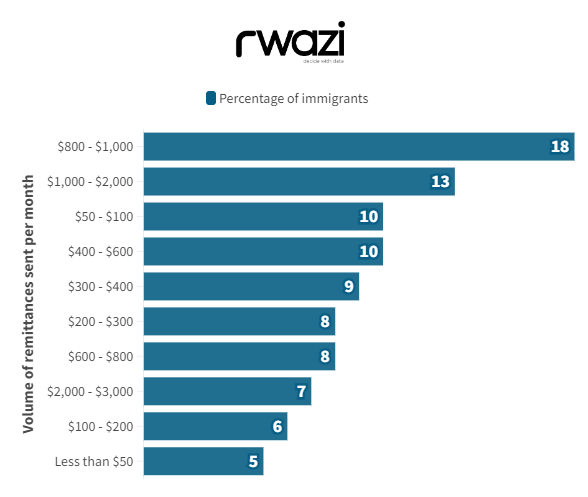
Remittance growth by percentage of immigrants
Existing players like Western Union, MoneyGram International, and WorldRemit are now facing pricing pressure and competition for a share of remittance flows from Africa-focused fintech innovators. Compelling pricing, loyalty programs, and channel incentives will be key to defence.
 ChartEdition #1
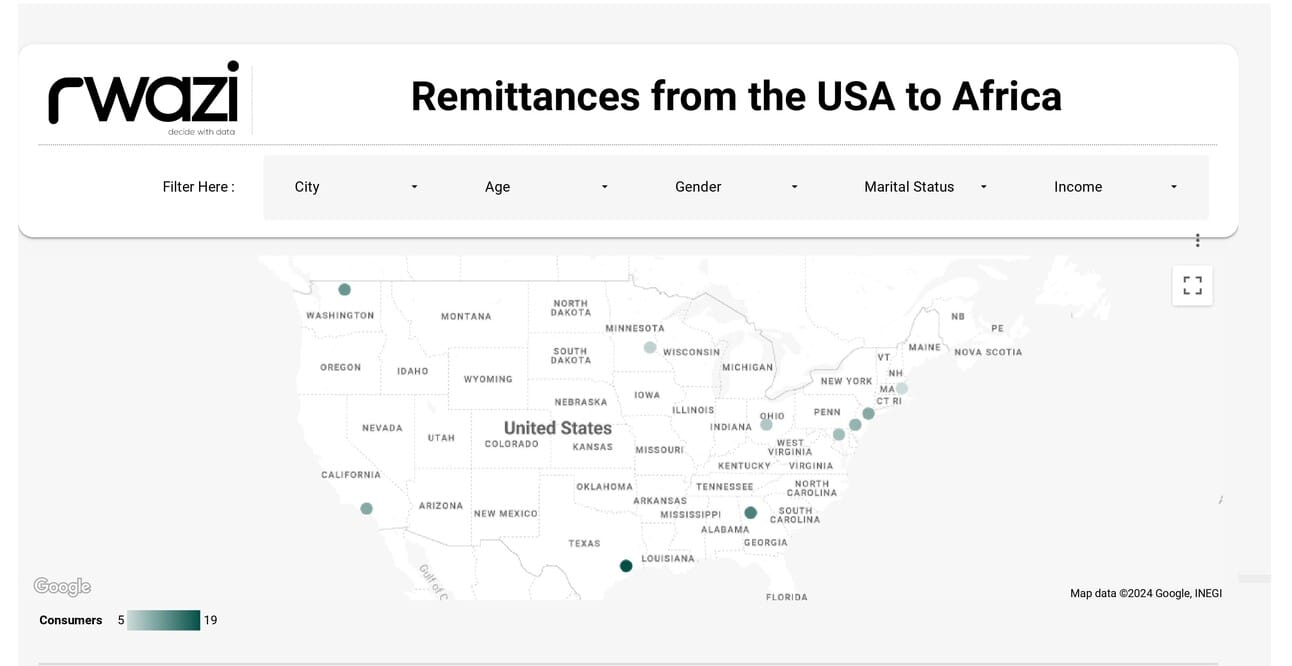
Evolving remittance trends from the US to Africa
No charts match that search.