Welcome back to Market Mosaic. This week, we analyse the smartphone industry's shift toward premium pricing, explore why cash persists across diverse economies despite digital payment infrastructure, and much more.
Register to join us this week on Thursday, November 20, for yet another live session in our Conversations with Market Mosaic series on LinkedIn Live, as we break down how consumer-sourced data is the new engine for growth.
Now, let's dive into our insights for this week.
— Insights Team, Rwazi

What’s your market persona as a business leader?
Our quiz discovers if you are an Explorer, Builder, Analyst or Strategist and how your business mindset shapes your market strategy.

Technology
Economy
Consumer Universe
Supply Chain

The premium smartphone era arrives as the industry matures
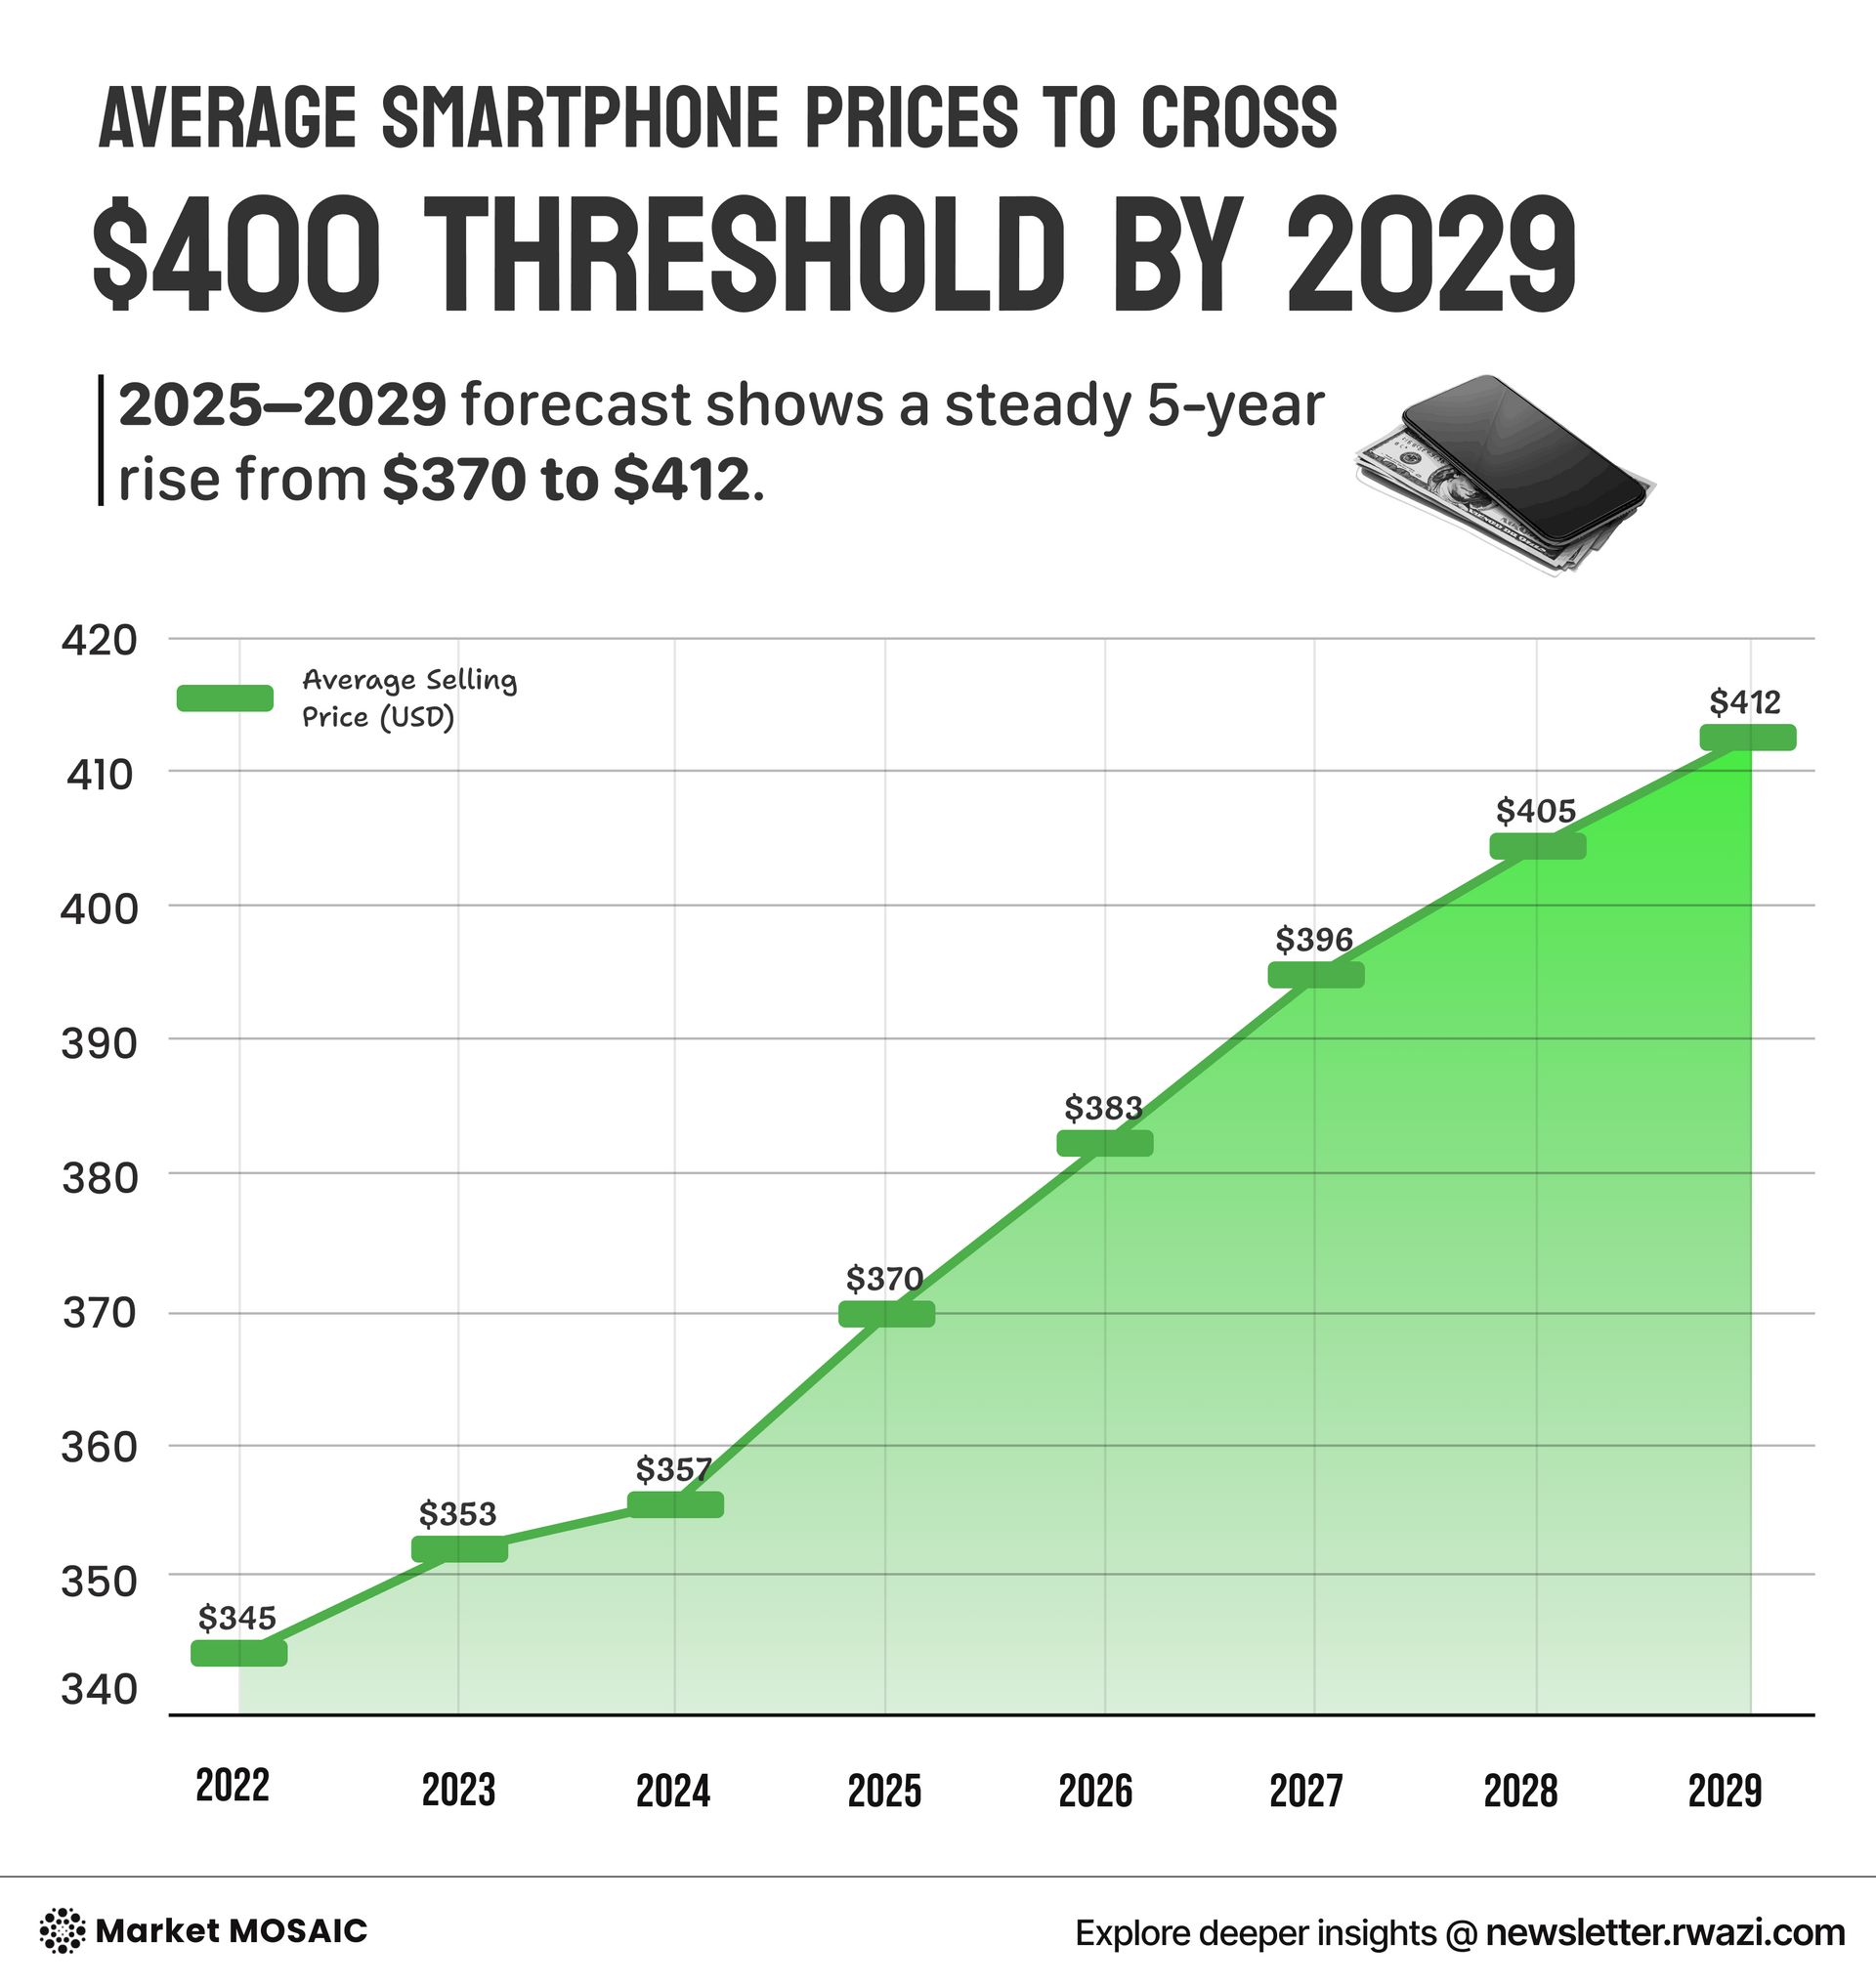
Do you know that the average smartphone prices are rising from 370 dollars this year to 412 dollars by 2029? Even with a revenue growth outpacing unit sales at 5% annually.
North America leads with prices approaching 984 dollars by 2026, driven by AI features and foldable devices. China shows measured growth at 3.6% as domestic brands push upward alongside Apple's Pro lineup recovery.
India remains most affordable under 250 dollars, but is trending toward 287 dollars by 2029 as secondary cities upgrade.
Generative AI features added up to $60 in production costs, yet consumers view these capabilities as essential rather than experimental, justifying premium pricing. Apple dominates with prices climbing toward 1,000 dollars by 2029 while preparing its first foldable for 2026.
Key Insights
Smartphones now shift from volume to value-driven growth as consumers prioritize AI capabilities and premium experiences over affordability, enabling sustained profitability beyond price competition.

Regional growth patterns show America's shifting economic centre
North Dakota and Texas now lead state GDP growth at 164% and 141% since 1998, driven by shale oil. Mountain West states like Utah, Idaho, Arizona, and Colorado posted 117% to 157% growth from population influx and business-friendly climates.
Tech hubs Washington, California, and Massachusetts grew 134%, 115%, and 87% respectively.
Traditional industrial states struggled dramatically. Louisiana, Michigan, West Virginia, and Connecticut posted just 23% to 35 percent gains, reflecting manufacturing decline.
These patterns redefine resource allocation priorities as high-growth states offer expanding consumer bases while lower-growth regions require careful positioning.
Key Insights
Economic growth concentrates in energy-rich, tech-driven, and lifestyle-oriented regions, requiring businesses to adapt strategies for different consumer preferences and purchasing power across state boundaries.

Cash still dominates despite digital payment growth
Cash usage varies by development level. Poorest nations like Myanmar, Ethiopia, and Gambia register 95% to 98% cash usage due to limited infrastructure. Wealthy nations Sweden, Norway, and South Korea, show just 10% to 14%. Developing markets remain sticky with Mexico at 80%, India at 70%, and Thailand at 65%.
Surprising outliers include Japan at 60% despite technological advancement, reflecting cultural privacy preferences, and Germany at 51% due to surveillance concerns.
China's remarkable 10% also shows leapfrogging to mobile payments via Alipay and WeChat Pay, bypassing traditional card infrastructure entirely.
Key Insights
Cash persists globally despite digital alternatives, reflecting infrastructure limitations and cultural preferences that resist rapid change.
Businesses must design payment strategies for local realities rather than assuming universal digital adoption.

China escalates agricultural tariffs over EV dispute
China targets Western agricultural sectors worth billions in retaliation for 100% EV tariffs.
Western governments maintain EV tariffs despite agricultural pressure, viewing electric vehicle protection as strategically critical for competitiveness and climate goals.
Agricultural tariffs may raise Chinese food prices while Western producers lose market access. Supply chain managers face growing uncertainty, particularly difficult for perishable products with seasonal cycles requiring rapid adjustments.
Key Insights
Trade policy driven by strategic competition creates persistent supply chain uncertainty.
Businesses must build resilience through diversification and scenario planning rather than assuming stable market access.

Are you building your global brand on data... or on what consumers actually say, feel, and do in real time?
In the noisy global market, how do you separate signals from the noise to build products that stick and marketing that resonates?
We are bringing together our industry experts for a conversation to explore how companies are using real-time insights to understand markets and build better products.
Date: Thursday, November 20, 2025
Time: 10:00 AM Eastern Standard Time (EST) / 7:00 AM Pacific Time (PT)

We are curating an exclusive Market Mosaic Circle, a private, premium community for business executives, leaders and professionals like you, with our exclusive benefits and high-class experiences.
To help us finalise the benefits and (literally) build the Circle for you, kindly let us know your level of interest in the poll below.
How interested are you in joining the exclusive Market Mosaic Circle?

Spotting trends is easy. Acting on them before your competitors do, that’s the challenge.
Sena was built to help teams move from insight to action faster, whether it’s entering new markets, reallocating resources, or adjusting strategy in real time.


Share the Market Mosaic with decision-makers in your circle. After 3 successful referrals, you will gain direct access to our insights discovery call with our experts, designed to help leaders like you turn insights into strategy.
Your referral count: {{rp_num_referrals}}
Before You Go…
Leaving already? Not so fast. Our published data stories are packed with the kind of actionable insights you will wish you’d seen sooner:


